

Confidence Calibration — Can the Score Route Human Review?
Confidence calibration on exact ground truth — 466,000 cells, and the default grader cannot rank errors
Section titled “Confidence calibration on exact ground truth — 466,000 cells, and the default grader cannot rank errors”Why this page exists. Every extracted field carries a confidence score, and the product’s review-effort estimator turns those scores into “review the worst N documents and you reach 99% accuracy”. That promise needs two separate properties from the score, and only one of them had ever been measured here. Calibration asks whether 0.9 really means 90%. Discrimination asks whether the wrong cells are the low-scoring ones — and discrimination is the only property worst-first review actually depends on. This page measures both, against exact per-cell ground truth, for each shipped confidence mode and grader model. The short answer is that the shipped default (
separatemode on Nova Lite) is well calibrated and undiscriminating: it places essentially every cell in one confidence bin, so it is nearly always right about the population and carries no information about which individual cells to look at.
What made this measurable. Nothing in the harness could join a confidence score
to the cell it described: the traversal collected the bare scalar and discarded the
field path, so the only available statistics were distributional — mean confidence,
percentage below a threshold, leaf count. None of those can be wrong about a
confidence score, because none of them compares it to anything. The scorer now walks
explainability_info with idp_common.evaluation.flatten_confidences, which is the
same field-path rule the product keys its stored confidence curves by, and joins each
path to the synthetic corpus’s per-cell truth through the unique SEQnnnnn row tag
(#935).
Method. Retroactive re-scoring: the confidence values and the extracted cells are
both already in the output bucket from the original runs, so this study reads S3 and
spends nothing on inference. Stack IDPUpg067to068, us-west-2, code version
v0.6.8, runs from 2026-09-12 → 09-15, re-scored 2026-09-21; the replication set is
stack IDP1, code version v0.6.9, runs from 2026-09-19. Seven synthetic
bank-statement documents (tiny_form, small_narrow, med_narrow, large_narrow,
longdesc_100, wide_400, manylists_400) with exact typed truth for the Date and
Amount cell of every tagged transaction row. Extraction, OCR and geometry are held
fixed across the grader arms; the only axis that moves is named in each table.
Every number the gate acts on comes from the shipped engine.
idp_common.evaluation.confidence_curve.ConfidenceCurve supplies the calibration
error, the binned AUROC and the reliability verdict, so those are statements about the
bars the product itself applies: ECE_UNRELIABLE_THRESHOLD = 0.15,
AUROC_UNRELIABLE_THRESHOLD = 0.55, MIN_OBSERVATIONS_FOR_MEASURED = 30,
MIN_OBSERVATIONS_FOR_AUROC = 100, MIN_BINS_FOR_SIGNAL = 3.
The two columns the gate does not read — the unbinned AUROC and the Brier
score — are computed locally in the harness, by analyze.unbinned_auroc(tally) from
the stored value tally and by sum((conf − correct)²) / n from the stored
brierSse. Both are asserted equal to the metric classes the evaluation service
passes to compare_with — Stickler’s AUROCMetric and BrierScoreMetric — in
benchmarks/tests/test_confidence_calibration.py, rather than being claimed equal
here. The two assertions do not carry the same tolerance, and the difference is worth
knowing before quoting either. The AUROC is compared as a float, abs(mine − theirs) < 1e-12, so the equivalence is exact to numerical precision. The Brier score is
compared at the 4 decimal places the harness stores, round(sse/n, 4) == round(theirs, 4), which detects a relative error of 1e-4 on the squared-error sum and not 1e-5 — a
real check at the precision the artifact carries, which is the precision every Brier
figure on this page is quoted to, but not a 1e-12 one.
Computing both locally is what keeps the [evaluation] extra off the default scoring
path, so a synthetic scoring run does not die part-way through a grid for a missing
metric library — see the Reproduce section. ⚠️ The consequence for the three
equality assertions is that they are importorskip-guarded, so they are vacuous
where stickler is absent: they skip silently and the suite still reports green.
They are live in CI, which installs the test extra.
1. The headline: same extraction, same error count, opposite verdicts
Section titled “1. The headline: same extraction, same error count, opposite verdicts”The cleanest contrast in the grid is a single-axis one. Two arms differ in exactly the confidence model and nothing else — same extraction model (Sonnet 4.6), same classifier, same OCR, same seven documents, same 70,242 scored cells:
| Confidence grader | Cells | Wrong cells | ECE (mean-conf) | Brier | AUROC (binned) | AUROC (unbinned) | Populated bins | Shipped verdict |
|---|---|---|---|---|---|---|---|---|
nova_2_lite | 70,242 | 64 | 0.0005 | 0.0009 | 0.500 | 0.465 | 1 | degenerate, undiscriminating |
sonnet5 | 70,242 | 66 | 0.0244 | 0.0014 | 0.772 | 0.859 | 6 | reliable |
Extraction quality is indistinguishable between the two — accuracy 0.9991 with a 95% Wilson interval of [0.9988, 0.9993] on both sides, 64 versus 66 wrong cells out of the same 70,242. So the difference in the right-hand columns is the grader and cannot be anything else.
The shipped default grader, Nova Lite, behaves like nova_2_lite rather than like
sonnet5:
| Confidence grader | Mode | Cells | Wrong cells | ECE (mean-conf) | AUROC (unbinned) | Bins | Verdict |
|---|---|---|---|---|---|---|---|
nova_lite (shipped default) | separate | 70,320 | 55 | 0.0037 | 0.417 | 1 | degenerate, undiscriminating |
nova_2_lite | separate | 70,242 | 64 | 0.0005 | 0.465 | 1 | degenerate, undiscriminating |
sonnet5 | separate | 70,242 | 66 | 0.0244 | 0.859 | 6 | reliable |
nova_lite (shipped default) | integrated | 8,818 | 0 | 0.0031 | — | 2 | degenerate |
nova_2_lite | integrated | 8,820 | 0 | 0.0007 | — | 1 | degenerate |
sonnet5 | integrated | 8,820 | 0 | 0.0197 | — | 3 | reliable |
The nova_lite arm carries one confound worth naming: the only v0.6.8 grid cell with
confidence_model: nova_lite and extraction on Sonnet 4.6 came from the suite that
overrides the classification model to Sonnet 5, while the other two arms ran the
coresynth default classifier. On a single-class synthetic corpus the classifier does
not touch the extracted cell values, and the data agrees: the arm scores 70,320 cells
at accuracy 0.9992 [0.9990, 0.9994] against 70,242 at 0.9991 [0.9988, 0.9993], which
is the same extraction to within the interval. The nova_2_lite-versus-sonnet5 pair
above has no confound at all and shows the same split, which is why it is the headline.
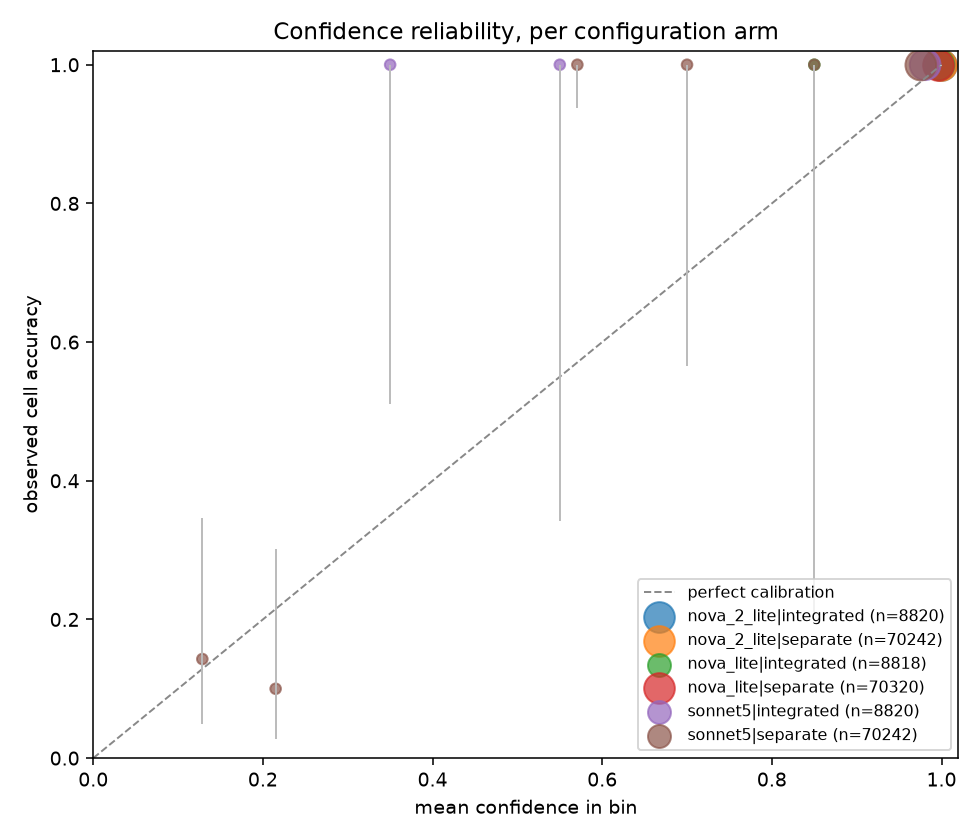
Read the diagram by marker position, not by marker count. Every Nova arm is one enormous marker at (≈1.0, ≈1.0): all of its mass sits in the top bin, at a mean confidence of 0.995 and an observed accuracy of 0.999. The Sonnet 5 arm has the same dominant top-bin marker and two small markers near the bottom-left of the diagonal, at mean confidence 0.129 and 0.215 with observed accuracy 0.143 and 0.100. Those two bins hold 41 cells, 36 of which are wrong — over half of the arm’s 66 errors, sitting where a worst-first queue reaches them first.
2. Why a passing ECE says nothing here
Section titled “2. Why a passing ECE says nothing here”Every arm in the grid passes calibration. The largest mean-confidence ECE anywhere above is 0.0244, against a gate that fires at 0.15. Two of the arms also pass with a gross defect present, which is the point:
| Arm | Cells | Wrong cells | Accuracy [95% Wilson] | Mean confidence | ECE (mean-conf) | AUROC (unbinned) |
|---|---|---|---|---|---|---|
separate / nova_lite / extraction astra | 54,484 | 1,413 | 0.9741 [0.9727, 0.9754] | 0.9952 | 0.0211 | 0.520 |
separate / nova_lite / extraction nova_lite | 11,462 | 2,875 | 0.7492 [0.7412, 0.7570] | 0.9933 | 0.2441 | 0.541 |
The first row is the failure this whole exercise was built to find. 1,413 cells are wrong; the grader asserted a mean confidence of 0.9952 over all 54,484 of them; every single cell landed in the top bin; and the calibration error is 0.0211 — comfortably inside the reliability bar. A release validated on ECE alone would have shipped that. Discrimination is 0.520, which is chance.
The second row is the one calibration does catch: at 25% of cells wrong and a mean
confidence still above 0.99, the mean-confidence ECE reaches 0.2441 and the shipped
overconfident flag fires. So the ECE gate is not useless — it detects gross
overconfidence. What it cannot detect is a 2.6%-wrong extraction described at 99.5%
confidence, and 2.6% wrong is the regime a real deployment lives in.
⚠️ That second row is also the thinnest arm in the grid: 58 of its 112 runs completed with joinable confidence, over 6 documents rather than 7. Read it as directional — see §6, which gives every arm’s own run, document and excluded-run count. The first row (102 of 112 runs, 7 documents) and the three headline arms in §1 (112 of 112, nothing excluded) do not carry that caveat.
Two ECE estimators, and the difference matters. The shipped
CalibrationHealth.ece compares each bin’s accuracy to the bin midpoint, because
the curve stores counts rather than the confidences themselves. That puts a floor
under it: a set of cells all scored 1.00 and all correct is perfectly calibrated and
still reports 0.05, the distance from 1.00 to the top bin’s midpoint of 0.95. That is
well inside the 0.15 bar so the gate does not misfire, but 0.05 is not the grader’s
calibration error and must not be quoted as one. Every ECE in this page’s tables is
the mean-confidence estimator, which is what Stickler’s ECEMetric computes and what
the reliability diagram plots. The harness records both, as
calibration_ece (the gate’s) and calibration_ece_mean_conf.
3. The verdict that does not depend on a statistical estimate
Section titled “3. The verdict that does not depend on a statistical estimate”bin_coverage is the column to trust most, because it is a structural fact rather
than an estimate. MIN_BINS_FOR_SIGNAL is 3: a confidence score occupying fewer than
three of the ten 0.1-wide bins cannot order a review queue, because almost every cell
ties with almost every other one. Both Nova graders put all 70,000-odd cells in a
single bin. No amount of additional data changes that reading, and it is what makes
the degenerate flag fire ahead of any AUROC question.
That matters because the AUROC estimates themselves are imprecise, and the cell count is the wrong number to judge their precision by. AUROC is estimated over wrong × correct pairs, so the binding sample size is the wrong-cell count: 55, 64 and 66 in the three headline arms. An arm with 70,320 cells and 55 errors is a 55-observation measurement of ranking power however large the cell count looks — which is why the harness prints the error count next to the AUROC columns.
No interval is reported for AUROC, deliberately. The Wilson intervals on this page
are on genuine binomial proportions — overall accuracy, and each reliability bin’s
accuracy — computed with idp_common.evaluation.wilson_interval. AUROC is a
proportion of pairs, and the pairs are not independent (each cell appears in many of
them), so a Wilson interval on it would be wrong in a direction that flatters it. The
honest statements are therefore: the Nova arms’ point estimates (0.417, 0.465, 0.520,
0.541) are indistinguishable from chance on 55–1,413 errors, and the reading “very
slightly worse than chance” is not supported — the shipped gate’s threshold-crossing
verdict rests on the single-bin structure, not on the sign of the deviation. The
Sonnet 5 arm’s 0.859 on 66 errors is far enough from 0.55 that the direction is not in
doubt, though the second decimal place is.
4. What integrated mode could and could not be measured on
Section titled “4. What integrated mode could and could not be measured on”Six of the seven integrated-mode arms returned zero wrong cells: 8,814 to 8,820
cells per arm, all correct. Discrimination is undefined when one class is absent — there
are no wrong cells to rank — so those rows report — rather than a number, and reading
the absence as a good result would be exactly backwards.
The seventh is the arm where extraction itself was Nova Lite, and it is a different
animal: 998 cells over 5 documents and 6 of the 14 runs, the other 8 excluded,
with 318 wrong cells, a mean-confidence ECE of 0.310 and both overconfident and
undiscriminating set. It is the thinnest arm in the grid — see §6’s table for the
per-arm counts — and it is not a measurement of integrated mode so much as of a broken
extraction.
Because it does have errors, it is the only integrated arm with a ranking-power
number at all, and the number is 0.5594 unbinned (Brier 0.3112, binned AUROC 0.500).
It is reported here for the same reason §3 gives for reporting bin coverage first: on
318 wrong against 680 correct the Hanley–McNeil standard error is 0.0197, which puts
0.5594 three standard errors above chance but only half a standard error above the 0.55
bar — an approximate 95% interval of [0.521, 0.598], and wider still under §6’s
non-independence argument, which applies here too. The structural reading is the one to
carry: all 998 cells sit in one bin, so every pair of cells ties and the ordering is
arbitrary whatever the statistic reads. undiscriminating is set, and it is set for the
same reason it is set on the separate Nova arms.
State the power floor rather than the null for the other six. With 0 errors observed in
8,820 cells, the 95% Wilson interval on accuracy is [0.999565, 1.0], so the true
cell-error rate could be as high as 1 in 2,297 and still produce this observation. At
that rate the 7-document, 14-run integrated grid would be expected to yield 3.84
errors — against MIN_OBSERVATIONS_FOR_AUROC of 100. So for those six arms ranking power
is unmeasurable for want of errors, and unmeasurable for a sample-size reason that
more repeats of these documents would fix only slowly: reaching 100 errors at the upper
bound of the error rate would take roughly 230,000 cells, about 26 times this grid.
Put the two halves together and the honest statement about the mode is this: on the six
arms where extraction works there are too few errors to measure ranking power at all,
and on the one arm with errors it measures 0.559 on a single bin, which is
undiscriminating. Neither half licenses “integrated mode ranks errors”. The one thing
measured across every arm is bin coverage, and it splits the same way as separate:
1 to 2 bins on the Nova graders, 3 on Sonnet 5.
The arms are also not equally powered against each other: separate ran 112 runs per
arm and integrated 14, because the coresynth grid allocates them that way. No
separate-versus-integrated comparison on this page should be read as a controlled
one.
5. Replication
Section titled “5. Replication”The v0.6.9 grid, on a different stack (IDP1) and a different code version, was
re-scored the same way. The sonnet5 grader was not in that grid, so the positive
result rests on one release; the negative result reproduces to three decimal
places:
| Arm | v0.6.8 cells / errors / AUROCu / bins | v0.6.9 cells / errors / AUROCu / bins |
|---|---|---|
separate / nova_lite / sonnet46 | 70,320 / 55 / 0.417 / 1 | 70,320 / 57 / 0.419 / 1 |
separate / nova_lite / sonnet5 | 65,864 / 43 / 0.382 / 1 | 64,342 / 58 / 0.428 / 1 |
separate / nova_2_lite / sonnet46 | 70,242 / 64 / 0.465 / 1 | 70,260 / 68 / 0.465 / 1 |
separate / nova_lite / astra | 54,484 / 1,413 / 0.520 / 1 | 70,542 / 1,806 / 0.557 / 1 |
separate / sonnet5 / sonnet46 | 70,242 / 66 / 0.859 / 6 | not run |
6. What this does and does not license
Section titled “6. What this does and does not license”Which shipped configuration can support worst-first human review. On this corpus,
only confidence.model: us.anthropic.claude-sonnet-5 can. The shipped default,
separate mode on us.amazon.nova-lite-v1:0, cannot: it is degenerate by bin
coverage and undiscriminating by AUROC, in two releases on two stacks. A review queue
ordered by its scores is ordered arbitrarily, and the review-effort estimator’s
recommendReviewAll is the correct output for it — which is what the shipped estimator
already returns, because calibration_health() sets both flags.
Two arms sit fractionally above AUROC_UNRELIABLE_THRESHOLD (0.55) and neither joins
Sonnet 5 on the usable side of this conclusion. Both appear in the Reproduce output
below, so expect to see them there:
| Arm | Unbinned AUROC | Bins | Errors |
|---|---|---|---|
separate / nova_lite / astra, v0.6.9 | 0.557 | 1 | 1,806 |
integrated / nova_lite / nova_lite, v0.6.8 | 0.559 | 1 | 318 |
The reason neither counts is the argument in §3 rather than the AUROC figure: each
arm’s cells occupy one bin, so each is degenerate and its ordering is arbitrary
whatever the ranking statistic reads. The astra arm reads 0.520 in v0.6.8 and 0.557 in
v0.6.9 — two releases straddling a threshold by 0.007 on an estimate this imprecise is
exactly the situation in which a point estimate should not decide anything. The
integrated arm’s 0.559 carries a 0.020 standard error (§4), which places it half a
standard error above the bar.
This is not a recommendation to change the default. The default is a cost
decision, and the cost gap is large: base-confidence.yaml records a live A/B at
~$0.0011 per document on Nova Lite against ~$0.145 on Sonnet 5, about 130×. Nothing
measured here disturbs that number. What the page changes is the basis on which the
trade-off is made — the comment justifying Nova Lite spoke only to cost, and the
calibration half of the trade was assumed rather than measured. Deployments that use
confidence as an alerting signal against a threshold are largely unaffected: the
scores are well calibrated, and a threshold on a population that is 99.9% correct
behaves as advertised. Deployments that use confidence to rank a review queue
should either move the grader to Sonnet 5 for that workload, or treat the queue as
unordered and size review by the audit sample instead.
What this corpus cannot tell you. Three limits, in order of how much they bind.
1. The cells are not independent, and the mechanism is mechanical duplication rather
than correlation. reconcile_assessment_to_data’s _expand_row_to_per_column fans
one per-row confidence out across every populated scalar column of that row, so a
row’s cells frequently carry the identical value by construction. Measured in
separate/nova_lite on wide_400: 396 to 400 of the 400 rows have every column
carrying the same confidence.
The whole distribution is countable from the committed artifact, because each row’s
calibration_curve.valueTally is keyed by distinct confidence value. Over the joinable
cells — the Date and Amount of each tagged row, 800 per 400-row document; the
Description cell carries the SEQ tag and is not scored — a document-run holds:
| Grader | Mode | Runs | Distinct confidence values per document-run | Median |
|---|---|---|---|---|
nova_lite | separate | 832 | 1 – 5 | 2 |
nova_lite | integrated | 100 | 1 – 5 | 2 |
nova_2_lite | separate | 224 | 1 – 7 | 2 |
nova_2_lite | integrated | 24 | 1 – 7 | 3 |
sonnet5 | separate | 112 | 1 – 8 | 4 |
sonnet5 | integrated | 14 | 1 – 7 | 3 |
So “70,320 cells” is not 70,320 independent scores and should not be read as one — the whole 70,320-cell arm is 112 runs of a two-to-five-valued score. Every interval on this page treats cells as independent and therefore reports less uncertainty than is really present.
This is also why §3 rests the conclusion on bin coverage rather than on the AUROC point estimate. A grader whose entire output is two distinct values cannot order a review queue, and that statement does not depend on any sample size at all.
2. Error scarcity, and the arms are unequally powered. Discrimination is estimated over wrong × correct pairs, so the binding sample is the wrong-cell count, not the cell count. Per-arm, for v0.6.8:
| Arm | Runs | Documents | Cells | Wrong cells | Excluded runs |
|---|---|---|---|---|---|
separate / nova_lite / sonnet46 | 112 | 7 | 70,320 | 55 | 0 |
separate / nova_2_lite / sonnet46 | 112 | 7 | 70,242 | 64 | 0 |
separate / sonnet5 / sonnet46 | 112 | 7 | 70,242 | 66 | 0 |
separate / nova_lite / sonnet5 | 112 | 7 | 65,864 | 43 | 0 |
separate / nova_lite / opus5 | 112 | 7 | 69,804 | 0 | 0 |
separate / nova_lite / astra | 102 | 7 | 54,484 | 1,413 | 10 |
separate / nova_lite / nova_lite | 58 | 6 | 11,462 | 2,875 | 54 |
integrated, six strong-extraction arms | 14 | 7 | 8,814–8,820 | 0 | 0 |
integrated / nova_lite / nova_lite | 6 | 5 | 998 | 318 | 8 |
Two consequences the grid-level totals hide. The nova_lite-extraction arm — the one §2
uses to argue that calibration does catch gross overconfidence — is a 58-run,
6-document arm with 54 of its 112 runs excluded, and the astra arm excluded 10. The
harness reports each arm’s exclusions by reason, and the three arms that have any split
like this:
| Arm | Did not complete | No confidence at all | Confidence, no joinable cell |
|---|---|---|---|
separate / nova_lite / nova_lite | 26 | 6 | 22 |
separate / nova_lite / astra | 0 | 0 | 10 |
integrated / nova_lite / nova_lite | 6 | 0 | 2 |
The third column is the one to read carefully: those runs completed and produced confidence, and were excluded because extraction returned no SEQ-tagged row for the scores to be joined to. So the surviving runs in these arms are conditioned on extraction success in a way the numbers alone do not show; on an arm that fails half its runs, the cells that survive are plausibly the easier ones. Treat those arms as directional. The five 112-run arms excluded nothing and carry no such conditioning.
The astra arm (1,413 errors) and the nova_lite-extraction arm (2,875 errors) remain
the only arms where the AUROC estimate is thick, and both agree with the thin ones.
3. Synthetic documents. These are generated PDFs with clean text and regular tables. A real corpus with OCR noise would produce a different error population, probably a larger one, and possibly one the graders separate better.
Reproduce
Section titled “Reproduce”Every figure on this page is reproducible with no AWS access at all. The
calibration_curve payload in each committed summary.json — the ten-element bin
counts plus brierSse, confSum and valueTally — is an exact sufficient statistic
for pooled ECE, mean-confidence ECE, Brier, bin coverage and both AUROCs, so
--calibration reads it from the artifact and only falls back to S3 for a row that has
none. Verified: re-running the commands below with no credentials reproduces all
fourteen arms, every reliability bin and the committed figure byte-for-byte.
That matters more than it sounds, and the reason is sharper than stack deletion. Three
v0.6.x release stacks are gone outright. A fourth, IDPUpg068to069, still has its
bucket and every object in it — and every object is unreadable, because the stack’s
KMS key has entered pending-deletion, so GetObject answers
KMS.KMSInvalidStateException. Its corefast grid therefore carries no calibration
statistic and cannot be made to: the backfill reports the read error rather than
recording the grid as having had no confidence, which is what a silently-swallowed
decryption failure would otherwise look like. An artifact’s readable lifetime is the
shorter of its bucket’s and its key’s, and neither is under this repository’s control.
That argument is the reason every grid still readable was backfilled, not only the
ones this page reports: all nine coresynth grids on IDPUpg067to068 and all four on
IDP1. Two of the nine — coresynth__classification-model-haiku45 and
coresynth__extraction-model-sonnet5-1m — add configuration arms this page does not
discuss, and are excluded from the commands below for that reason rather than because
their data is unavailable. Leaving a recoverable grid unbackfilled is what the
readable-lifetime argument exists to prevent.
Add --calibration-from-s3 to bypass the stored statistic and re-read every run from
the bucket. That is what a freshly-completed grid needs, and what verifies the stored
statistic against its source.
Prerequisites. idp_common must be importable — pip install -e "lib/idp_common_pkg[core]" from the repository root, then PYTHONPATH=lib/idp_common_pkg
as below. PYTHONPATH alone puts the source tree on the path but not its dependencies.
Nothing here needs the [evaluation] extra: the calibration statistics are computed
through idp_common.evaluation.confidence_curve and curve_store, which are
standard-library-only by design, and the unbinned AUROC and Brier score are derived from
the stored value tally and squared-error sum rather than by calling Stickler.
matplotlib is needed only for the reliability diagram, which is skipped with a message
if it is absent. AWS_PROFILE is not needed either for a --calibration run over
these committed summaries: no boto3 client is constructed unless a row is missing its
stored statistic, so an environment with no ~/.aws/config at all reproduces the whole
page.
# Only needed for a --calibration-from-s3 run, which joins against the truth files.# ⚠️ This writes PDFs into benchmarks/corpus/docs/ AND rewrites the tracked# benchmarks/corpus/manifest.yaml with absolute paths for your checkout — expect a dirty# working tree afterwards, and revert the manifest before committing anything.python3 benchmarks/harness/gen_corpus.py
# The headline single-axis grader contrast + the reliability diagram.PYTHONPATH=lib/idp_common_pkg python3 benchmarks/harness/aggregate.py \  --calibration \    benchmarks/results/v0.6.8/coresynth__classification-model-sonnet5/summary.json \    benchmarks/results/v0.6.8/coresynth__confidence-model-nova-2-lite/summary.json \    benchmarks/results/v0.6.8/coresynth__confidence-model-sonnet5/summary.json \  --calibration-group confidence_model,assessment
# The full v0.6.8 matrix behind §2 and §5: 14 arms, 466,322 cells. Seven suites, not# a glob over coresynth__* — the haiku-classifier and sonnet5-1m arms are excluded# because they add arms this page does not report.PYTHONPATH=lib/idp_common_pkg python3 benchmarks/harness/aggregate.py \  --calibration \    benchmarks/results/v0.6.8/coresynth__classification-model-sonnet5/summary.json \    benchmarks/results/v0.6.8/coresynth__confidence-model-nova-2-lite/summary.json \    benchmarks/results/v0.6.8/coresynth__confidence-model-sonnet5/summary.json \    benchmarks/results/v0.6.8/coresynth__extraction-model-astra/summary.json \    benchmarks/results/v0.6.8/coresynth__extraction-model-nova-lite/summary.json \    benchmarks/results/v0.6.8/coresynth__extraction-model-opus5/summary.json \    benchmarks/results/v0.6.8/coresynth__extraction-model-sonnet5/summary.json \  --calibration-group assessment,confidence_model,extraction_model
# The v0.6.9 replication set in §5 (stack IDP1).PYTHONPATH=lib/idp_common_pkg python3 benchmarks/harness/aggregate.py \  --calibration \    benchmarks/results/v0.6.9/coresynth__classification-model-sonnet5/summary.json \    benchmarks/results/v0.6.9/coresynth__confidence-model-nova-2-lite/summary.json \    benchmarks/results/v0.6.9/coresynth__extraction-model-astra/summary.json \    benchmarks/results/v0.6.9/coresynth__extraction-model-sonnet5/summary.json \  --calibration-group assessment,confidence_model,extraction_model
Reading the output from the stored statistic is seconds; --calibration-from-s3 over
either matrix takes several minutes and a few thousand S3 GETs, with no inference and no
DynamoDB access. The chart lands at benchmarks/paper/figures/reliability-diagram.png,
which is scratch — the copy this page cites was copied from there to
images/benchmark-v0.6.8-confidence-reliability.png, and a regenerated chart has to be
copied across again to change what the page shows.
⚠️ The chart leaves your working tree dirty, and benchmarks/.gitignore will not hide
it. That file explicitly un-ignores paper/figures/*.png — three tracked PNGs live
there — so a freshly-written reliability-diagram.png shows up as untracked rather than
being ignored. Delete it after a run, or leave it and do not stage it; do not
rm -rf benchmarks/paper, which takes the three tracked figures and the README with it.
Each arm reports its own runs, docs and excl counts, and the grid’s totals appear
in the trailing skipped: line. That line has five buckets, two of them are normally
non-zero for unrelated reasons, and the fifth is not a statement about the runs at all.
On the full v0.6.8 matrix above the first four read 32 unsuccessful, 0 without exact per-cell truth, 55 with no confidence at all, 34 with confidence but no joinable cell,
and each of the last two needs its own reading:
- no confidence at all — the run emitted no confidence leaf. This is expected at
one per
confidence.mode: offcell per document, and 49 of the 55 are exactly that. The other 6 areseparate-mode runs on the Nova-Lite-extraction arm whose assessment returned an emptyexplainability_info— and note they belong here rather than in the next bucket precisely because they produced no confidence, whatever their configured mode says. So a surplus over the off-cell count is expected, not a finding: the exact rule is that the surplus should sit in the same arms that also shownot_successorno_joinable_cellexclusions, which is where a failing extraction shows up. A surplus in a clean 112-run arm is the one worth chasing. - confidence but no joinable cell — the run completed and produced confidence
(6 to 148 leaves), and extraction returned no
SEQ-tagged row for those scores to be joined to. All 34 fall in the two weak-extraction arms. This is a statement about extraction completeness, not about confidence, and it is neither a missing S3 prefix nor a failed assessment: no S3 read is attempted for a row whose statistic is stored, and the assessment plainly succeeded. The per-armexclcolumn is where to localise it.
The fifth bucket, UNREAD, is the one to read differently from the other four. Those
four say what a run did; UNREAD says the harness could not look — the row’s section
objects were listed and then would not read, which is what a stack’s KMS key entering
pending deletion produces. A row here is not evidence that the arm emitted no
confidence, and an arm carrying any of these is pooled over the rows that did read, so
treat its figures as provisional and re-run the arm against a readable stack before
quoting them. The line prints the underlying error, and it reads 0 UNREAD on every grid
in this study.
So the escalation rule is per bucket, not on a pooled count: chase bucket three when it exceeds the off-cells, read bucket four as an extraction figure, and treat any count in bucket five as invalidating the arm it appears in rather than as a small exclusion. A summary whose stack no longer resolves to an output bucket prints a warning naming the stack, and says how many of its rows lacked a stored statistic and therefore could not contribute.
The per-release gate
Section titled “The per-release gate”analyze.score_synthetic records the per-document figures for every synthetic run, so
a grid scored from now on carries them without any backfill, and aggregate.cell_stats
pools them per cell. aggregate.compare_cells gates on the pooled figures:
- Calibration error worse by more than 0.01, measured on
ece_mean_conf. The mean-confidence estimator, not the gate’s own:ececompares each bin to its midpoint, so confidence moving within a bin is invisible to it — across the six grader arms above it spans 0.0013 whereece_mean_confspans 0.0239. - Ranking power worse by more than 0.05, measured on the unbinned AUROC, for the same reason. The binned estimator is even less mobile than midpoint ECE: across the 216 committed cells carrying a calibration block it is undefined on 183 and exactly 0.5000 on 29 of the 33 where it is defined, and across these two releases it moved 0.0000 on every configuration-matched arm while the unbinned value moved up to 0.0461.
- Either crossing its shipped bar —
ECE_UNRELIABLE_THRESHOLDorAUROC_UNRELIABLE_THRESHOLD— at any step size, because past those the estimator stops recommending a review subset at all. Both crossing checks read the gate’s own estimators,eceand the binnedauroc, because those are the values the shipped product applies the thresholds to. On a single-bin curve the AUROC crossing arm cannot fire at all — 0.5 is below 0.55 on both sides of any comparison — which is precisely why the magnitude arm must not read the same number.
Where the 0.01 threshold comes from, and what its real headroom is. Across the
eight configuration-matched arms of these two releases — four separate and four
integrated — the largest ece_mean_conf drift for an unchanged configuration is
0.0019, on integrated/nova_lite/sonnet5 (0.0036 → 0.0017). Among the separate
arms alone it is 0.0008, so 0.01 is 12.5× the separate-only drift and 5.3× the full
set.
But the gate fires per cell and those figures are per arm, and a cell is a much
smaller sample. Measured at cell granularity over the 72 configuration-matched cell pairs
the committed data supports: 0 of 72 would false-positive at 0.01, median |Δ| is 0.00075,
and the largest worsening is +0.0088 — on a cell whose pooled observations collapsed
4,410 → 410 between the releases. Excluding the two sample-collapse cells the largest
worsening is +0.0033. So the real headroom is 1.14× where n collapses and about 3×
where it does not. ⚠️ The gate has no stability-of-n guard:
MIN_OBSERVATIONS_FOR_MEASURED is 30, so n=410 clears the floor comfortably and its
noise is gated on as though it were the 4,410-observation measurement it replaced. The
finding line prints n 4410->410, but the decision to fire ignores it.
benchmarks/results/baseline.json carries both metrics, so the gate is live. A
comparison where either side lacks a metric is skipped, and compare_cells prints a
NOT COMPARED — one side lacks the metric block naming the metric, the side and the
affected cells rather than printing nothing, because an empty regression list from a
skipped gate and an empty one from a clean run are otherwise indistinguishable. Both
directions are reported, and the current-side gap is the common one: 13 of the 96
committed summaries carry a calibration statistic and 83 do not, so comparing this
release procedure’s
own named pair — v0.6.9/corefast/summary.json against baseline.json — compares a grid
with the statistic on 0 of its 171 rows against one carrying it on 162. That is the
IDPUpg068to069 grid, whose objects are undecryptable, so for those cells the gate is
permanently inert and now says so.