

Monitoring and Logging
Copyright Amazon.com, Inc. or its affiliates. All Rights Reserved. SPDX-License-Identifier: MIT-0
Monitoring and Logging
Section titled “Monitoring and Logging”The GenAIIDP solution provides comprehensive monitoring through Amazon CloudWatch to give you visibility into the document processing pipeline.
CloudWatch Dashboard
Section titled “CloudWatch Dashboard”The solution automatically creates an integrated dashboard that displays:
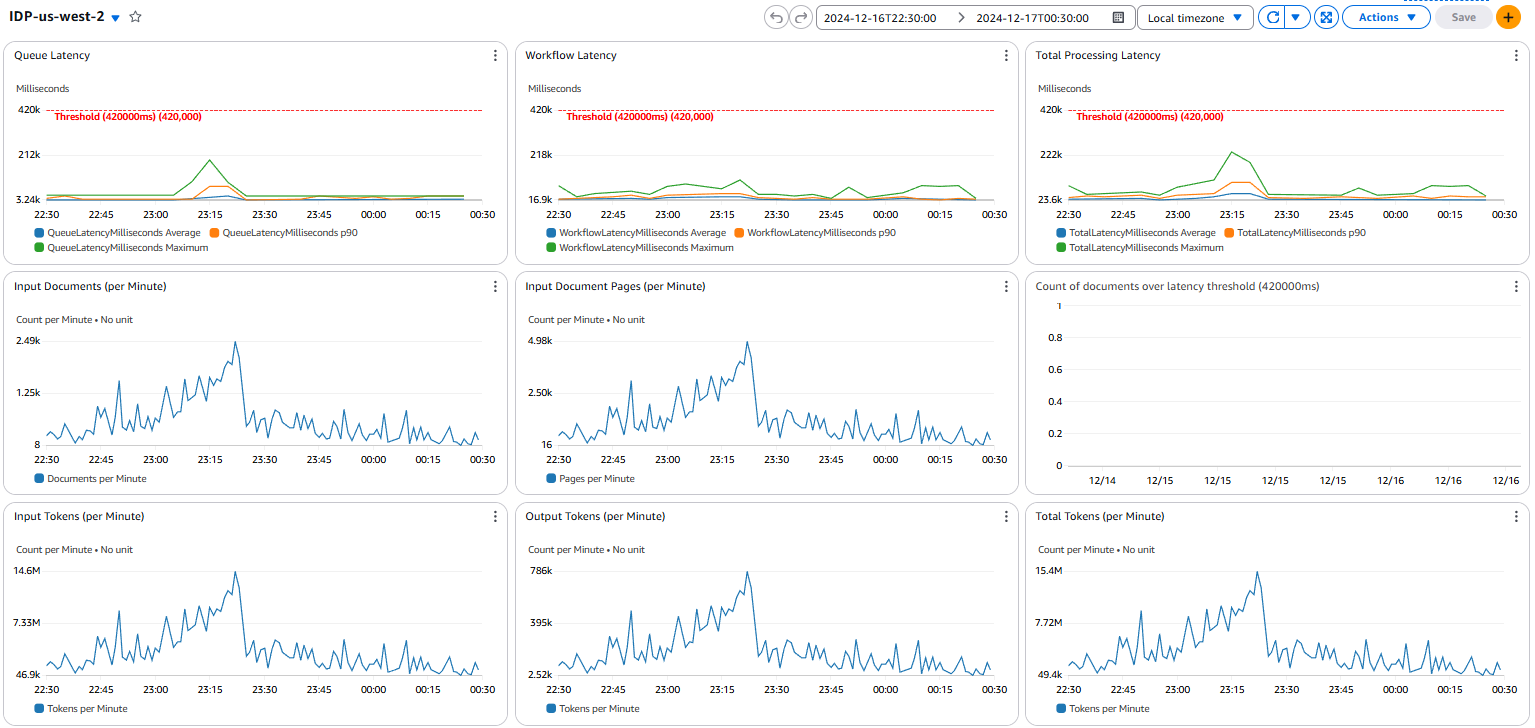
Latency Metrics
Section titled “Latency Metrics”- End-to-End Processing Time: Total time from document upload to completion
- Step Function Execution Duration: Time spent in workflow orchestration
- Lambda Function Latency: Processing time per function (OCR, Classification, Extraction)
- Queue Wait Time: Time documents spend in processing queues
- Model Inference Time: Bedrock model response latencies
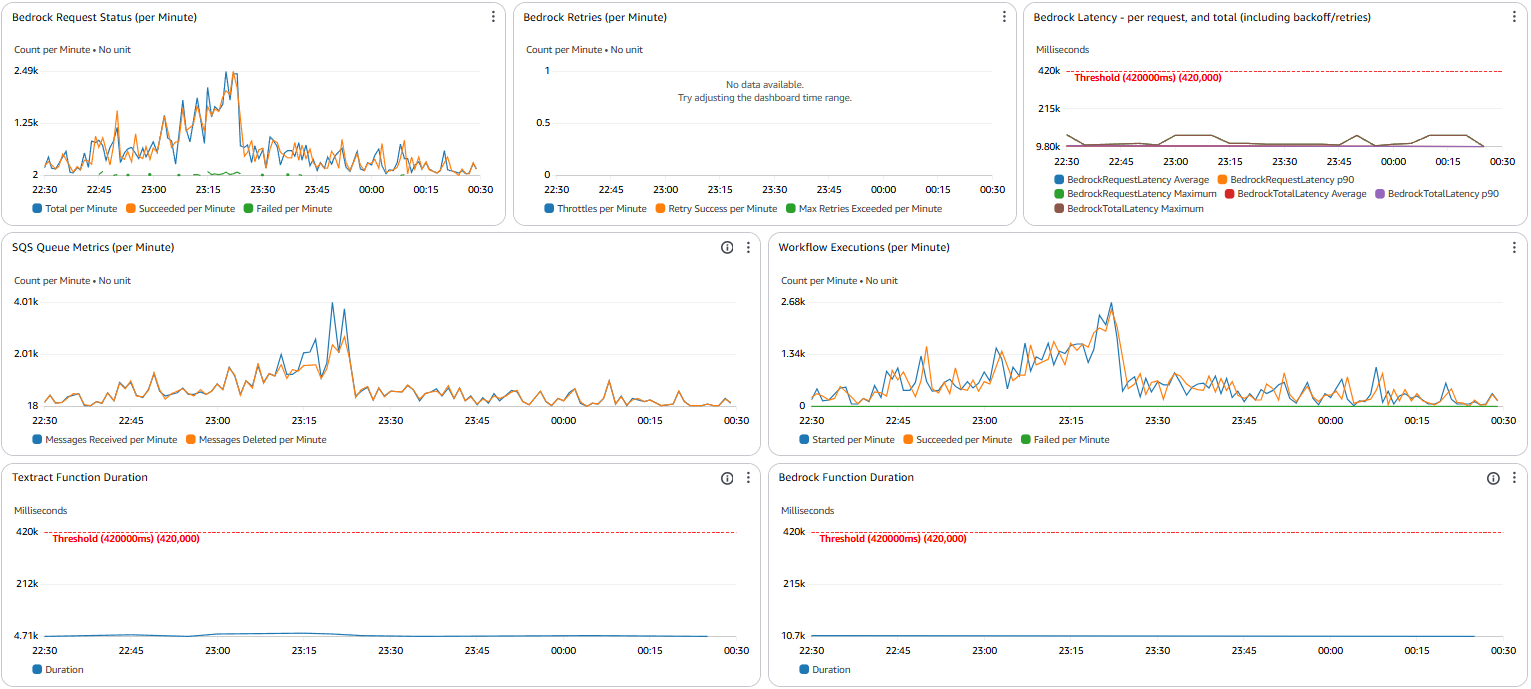
Throughput Metrics
Section titled “Throughput Metrics”- Documents Processed per Hour: Overall system throughput
- Pages Processed per Minute: OCR processing rate
- Classification Requests per Second: Page classification throughput
- Extraction Completions per Hour: Field extraction processing rate
- Queue Message Rate: SQS message processing velocity
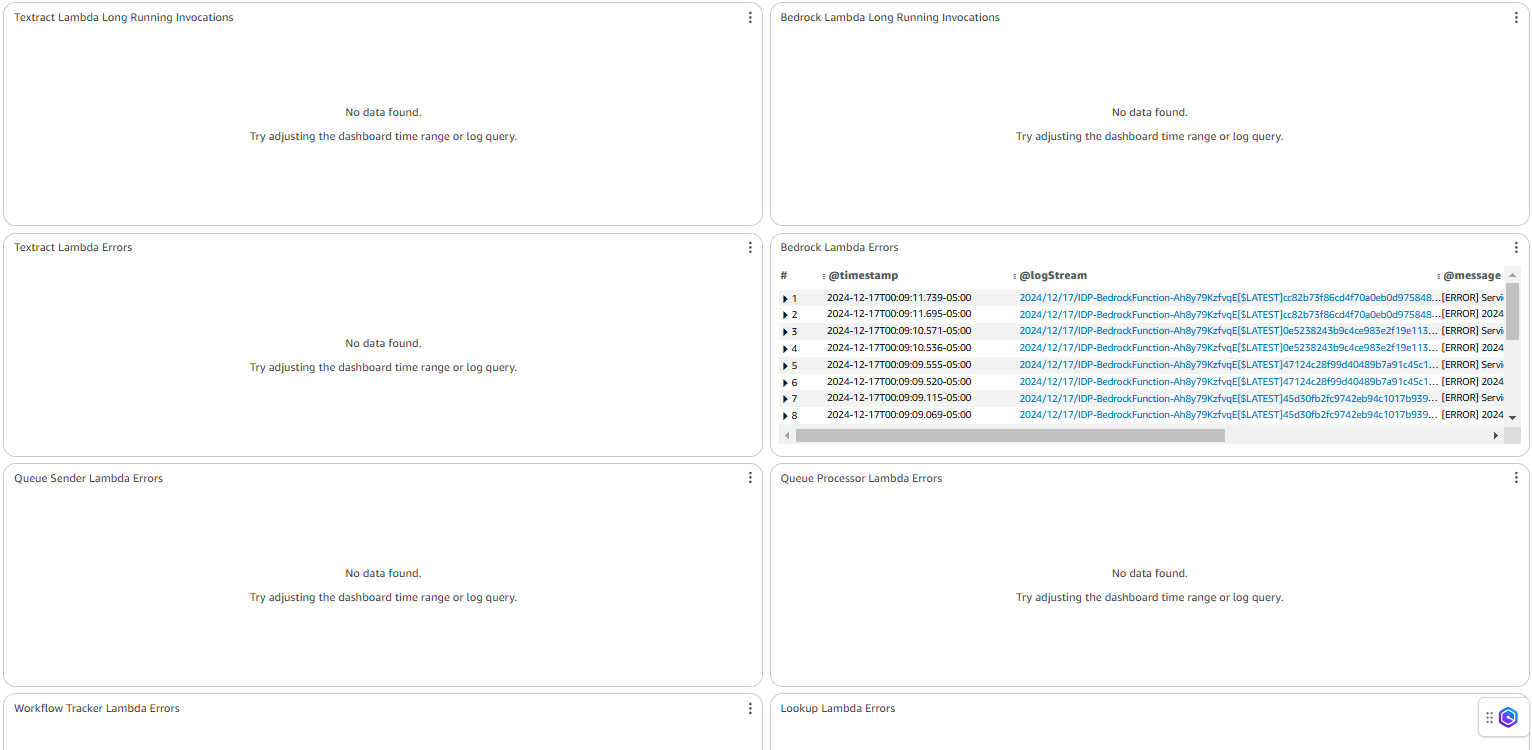
Error Tracking
Section titled “Error Tracking”- Workflow Failures: Step Function execution failures with error categorization
- Lambda Timeouts: Function timeout events and duration analysis
- Model Throttling: Bedrock throttling events and retry patterns
- Dead Letter Queue Messages: Failed messages requiring manual intervention
- Validation Errors: Data validation failures and format issues
Document Queue Backlog and Dead-Letter Queue Depth
Section titled “Document Queue Backlog and Dead-Letter Queue Depth”Two widgets cover the SQS layer between upload and execution, which is where a document can be lost or stuck without any Step Functions metric noticing:
- Document Queue Backlog — messages waiting, messages in flight, and the
age of the oldest message on the right axis, with a horizontal annotation
at
QueueStalledAgeThresholdSeconds. - Dead-Letter Queue Depth — the document, queue-sender, and workflow-tracker DLQs on one graph. Every line has its own alarm, and any non-zero value means a document that needs a human.
Reading the backlog widget: depth on its own is not a problem. The queue
processor gates on the workflow-concurrency counter and refuses a message by
letting its 30-second visibility timeout lapse, so a bulk upload legitimately
parks thousands of messages. Rising depth with a flat age line is a queue
draining under load. A climbing age line while the SQS throughput widget
shows nothing being deleted is a stall — see
DocumentQueueStalledAlarm.
Workflow Concurrency Counter
Section titled “Workflow Concurrency Counter”The stack limits in-flight workflows with a DynamoDB counter: the queue processor
increments it before StartExecution, and the workflow tracker decrements it on
the execution’s terminal event. If a decrement is ever lost, the counter drifts
upward and nothing puts it back — so once it reaches
MaxConcurrentWorkflows, documents stop starting permanently.
That failure is quiet. Every other signal looks idle rather than broken: no errors, no failed executions, latency graphs simply stop. The usual first symptom is a person noticing that nothing has processed for hours.
The counter can also drift the other way. Admission is gated on
active_count < MaxConcurrentWorkflows, so a counter driven below zero raises
the effective ceiling by exactly that much and nothing errors: documents process,
queues drain, every graph looks healthy, and the stack simply spends more on
Bedrock and Textract than it was configured to. Two guards in the tracker prevent
it: the decrement is refused when the counter is already at zero, and it carries a
dec#<executionArn> marker written in the same DynamoDB transaction, so a
redelivered terminal event cannot release a second slot. The markers expire via
the ConcurrencyTable TTL attribute (ExpiresAfter, seven days) rather than
accumulating one item per document forever.
Unlike the upward leak, a negative counter is not permanent even without intervention: every admitted document increments it, and once it climbs to the ceiling the floored decrements absorb the excess, so it converges back on its own. The over-admission is therefore bounded to roughly one generation of documents rather than lasting forever — which is why the guards and the repair below matter for cost and for predictable capacity rather than for recoverability.
Four metrics in the stack’s own namespace (<StackName>) make all of this
visible, all on the Workflow Concurrency Counter widget:
ConcurrencyCounterActive— the counter value, published on every document completion. Continuous, so there is a history to inspect after the fact. Its Minimum is plotted as well as its Average, because a single dip below zero is what matters and an average hides it.ConcurrencyCounterDrift— claimed slots minus executions actually running. Sampled only when an increment is refused, i.e. when drift is actually blocking work.ConcurrencyCounterUnderflow— a decrement that was refused because the counter was already at zero. Nothing else reports this: the counter and the document both end up correct, so without this metric a duplicate release is invisible.ConcurrencyDecrementSuppressed— a terminal event whose slot had already been released, recognised by itsdec#<executionArn>marker and skipped. This is the guard working, not a fault, so it has no alarm: EventBridge redelivery is expected (the rule allows three retries, and a tracker invocation that fails after the decrement lands is redelivered by design), and alarming on correct behaviour would be noise. It is worth watching as a series, because it is the only signal that terminal events are being redelivered at all — a rising count alongsideWorkflowTrackerDLQAlarmor tracker errors says the tracker is failing after it releases the slot.
Four alarms publish to AlertsTopic:
ConcurrencyCounterDriftAlarm— sustained drift (> 0 for 15 minutes). This fires on the symptom, once slots are already being held wrongly.WorkflowTrackerDLQAlarm— any message in the Workflow Tracker dead-letter queue. This fires on the cause: the tracker owns the decrement, so an event it could not process is a slot that was never released, and it alarms on the first message rather than waiting for drift to accumulate.ConcurrencyCounterUnderflowAlarm— any refused decrement. The floor already prevented the damage, so this is a correctness signal: something released a slot twice, and the reason is worth finding.ConcurrencyCounterNegativeAlarm— the counter observed below zero. This should be unreachable now that the decrement is floored; if it fires, the counter is being written by something that bypasses the floor.
The queue processor also self-heals, in two different places for the two different directions:
- Downward correction (the counter is too high) runs on a refused increment,
reconciling against
ListExecutionsand writing conditionally on the value it sampled. It requires the same discrepancy in two samples at least five minutes apart, because lowering the counter wrongly over-admits work. - Upward repair (the counter is negative) runs on the next successful
increment — which is where it has to be, because a negative counter always
satisfies
active_count < MaxConcurrentWorkflowsand so is never refused. The increment asks DynamoDB for the updated value, and a post-increment value of zero or below means it was negative before. The counter is then raised to the executions actually running plus the slot that increment just claimed (that execution does not exist yet, soListExecutionscannot see it), conditionally on the value observed, and never to a value below zero. So a negative counter is corrected within one admitted document rather than needing the queue to be at its ceiling first.
The repair publishes the pre-repair negative value — not the value the counter
reads after the increment — before it writes, so ConcurrencyCounterNegativeAlarm
still fires on a counter that healed itself. Without that a self-healed underflow
would leave no trace at all.
Reading the widget: the counter tracking a busy queue is normal. The counter
sitting at or near MaxConcurrentWorkflows while the SQS widget shows messages
in flight and the Step Functions widget shows nothing starting is the upward
leak. The counter minimum below the zero annotation, or any
ConcurrencyCounterUnderflow bar, is the downward one. A
ConcurrencyDecrementSuppressed bar on its own is the idempotency guard doing its
job.
Stale Output Purge on Re-upload
Section titled “Stale Output Purge on Re-upload”OCR has a retry-safe recovery path: on a Step Functions retry the document is
reloaded with pages={}, so before re-OCRing it scans
s3://<OutputBucket>/<key>/pages/ and reuses any page that already has all four
of its files (rawText.json, result.json, textConfidence.json, image.*).
That is what makes a throttled OCR retry cheap — and it is also why uploading a
different document under an existing filename used to produce the
previous document’s extraction (#719).
Two paths now purge before processing: the queue sender removes <key>/pages/
on every upload event, and the Reprocess action removes everything under
<key>/ except <key>/runs/ (matching its “start over” intent).
This failure is quiet in the same way the concurrency leak is: if the purge only partly succeeds, the document processes, reports success, and silently carries text from the old document — recovery needs just one surviving complete page to skip OCR for it. Processing deliberately continues on a purge failure (a possibly-stale extraction beats a dropped upload or a refused reprocess), so the signal has to come from a metric rather than the document’s own status.
One metric in the stack’s own namespace (<StackName>):
StaleOutputPurgeFailed— published (value1) whenever a purge raises. Both the ingest path and the reprocess path publish it, with no dimensions and into the root stack’s namespace, so one metric and one alarm cover both. Published only on failure, so no data means every purge succeeded.
One alarm publishes to AlertsTopic:
StaleOutputPurgeFailedAlarm— any occurrence within 5 minutes. Unlike concurrency drift there is no self-healing path: the stale pages sit in S3 until someone removes them, and every later upload of that key inherits the same wrong results — so this alarms on the first failure rather than on a sustained trend.
Two dashboard widgets are paired on the main dashboard: Stale Output Purge Failures (the count across both paths) and Stale Output Purge Failures — affected keys (a Logs Insights table over the Queue Sender log group).
Recovering: identify the affected keys, then delete
s3://<OutputBucket>/<key>/pages/ and re-upload or reprocess the document.
The log widget covers the ingest path; for the reprocess path, query the
ReprocessDocumentResolverFunction log group (in the API-resolvers nested
stack) instead. The two paths log different messages:
| Path | Log group | Message |
|---|---|---|
| Upload / re-upload | QueueSender | Failed to purge previous output data for <key> |
| Reprocess action | ReprocessDocumentResolverFunction | Failed to delete previous output data for <key> |
The most common cause is a KMS or bucket-policy change that denies
s3:DeleteObject to the purging role — check that before assuming a transient
S3 error.
Note: because the purge runs on every upload, a re-upload of a byte-identical file no longer reuses the prior OCR cache; it re-OCRs from scratch.
Confidence Assessment Degraded
Section titled “Confidence Assessment Degraded”Confidence assessment is an enrichment pass: extraction has already run,
written its results and been paid for by the time it starts. So when the
confidence model fails deterministically — most often
ValidationException: Input is too long for requested model., which a retry
would send again unchanged — the Assessment Lambda keeps the extraction and
degrades that section instead of failing the document
(#901).
The document completes, its extracted data is intact, and the gap is recorded as
an error-severity assessment_failed_confidence_unavailable processing issue on
the section.
A section can also reach the Assessment step with nothing to assess — no
extraction result written for it, no pages listed on it, an extraction result
whose inference_result is empty, or none of the pages it lists present in the
document. The confidence model is never called, so this
is not a confidence failure and the document completes for the same reason, but
the outcome for that section is identical: no confidence scores, and therefore no
coverage by confidence-based review. It is recorded as an error-severity
assessment_skipped_confidence_unavailable issue on the section
(#1006).
A section none of whose pages the document contains is skipped rather than
scored. With no page text and no page image the confidence model has nothing to
judge the extracted values against, and a score produced in that state is a
number with no evidence behind it — indistinguishable in the UI, in HITL routing
and in the reporting lake from one read off the page. So the pass does not run for
it, and the section is reported as unscored like the other nothing-to-assess
cases. A section missing only some of its pages still gets confidence scores,
because partial evidence is not no evidence, and carries a warning-severity
assessment_pages_missing issue naming the absent pages; that case publishes no
metric, since the section is not coming back without confidence. Either way the
cause is upstream — check the Classification step’s section boundaries and the OCR
step’s page list.
Not every empty result is a gap, though. Extraction records why its effective
schema was empty (metadata.empty_schema_reason in the section’s result.json),
and two of the three causes report nothing here:
- the class has no attributes to extract — it is in configuration and declares none. An authoring choice; nothing was expected from the section;
- classification determined no class, so the section is labelled
unclassified— a blank page, a page whose classification failed, or any page in a deployment with no document types configured. The classification stage reports this one, at the severity it can judge and with a remedy that points at the right place. An error indicator and an alarm data point per blank page would make both this page’s alarm and that indicator useless; - the section’s named class is absent from the configuration in force — renamed
or deleted while documents were in flight, an old document reprocessed under a
newer configuration, or a classifier prediction outside the configured vocabulary
on a path that does not enforce one. That is a fault: the section’s fields were
never extracted. It is reported here, alongside an error-severity
extraction_class_not_configuredissue from the Extraction step.
⚠️ That last case is not always rare, and which configuration you run decides
it. On the default multimodalPageLevelClassification with
enforceValidClasses on, an out-of-vocabulary prediction is retried and then
coerced to invalidClassFallback, so it becomes the silent unclassified case
above and the count really is bounded by configuration edits. Two other supported
configurations store the model’s invented class name verbatim —
textbasedHolisticClassification, which has no enforcement loop at all, and
multimodalPageLevelClassification with enforceValidClasses: false — and there
the rate follows model output rather than operator action. Small, cheap
classification models are the most prone to those predictions. On either of those
paths expect data points proportional to throughput, and use
ConfidenceUnavailableThreshold to set the volume at which it is worth paging;
better still, define the classes the model keeps reaching for, or turn enforcement
on. The report itself is correct either way — the section holds no data — so the
parameter, not a carve-out, is the right lever.
The first two report nothing at all, exactly as an excluded class does.
That is the right trade for one section, and it creates a monitoring gap for the
fleet (#996):
a systemic confidence failure no longer fails documents, so it no longer
lights WorkflowErrorsAlarm or any DLQ alarm. Without a metric it would be
visible only in the Sections panel, one document at a time. ProcessingIssueCount
does not help — it is a DynamoDB attribute on the tracking record, not a
CloudWatch metric.
One metric in the stack’s own namespace (<StackName>):
AssessmentConfidenceUnavailable— published (value1) by the unified pattern’sAssessmentFunction, with no dimensions, each time a section ends up with no confidence scores, whichever of the two causes above put it there. It reaches the root stack’s namespace because that function’sMETRIC_NAMESPACEis theStackNamethe parent passes down. The metric deliberately does not separate a failed confidence pass from a skipped one: the question it exists to answer is “are sections coming back without confidence?”, and the answer is yes either way. The section’s issue code is what tells the two apart once you open the document, and they point at different remedies — the confidence model for a failure, whatever produced the section for a skip. Nothing is published for a section the confidence pass was never going to score: one whose class is excluded, one whose class is in configuration with no attributes to extract, one that classification could not classify at all (which is what a blank page produces — the classification stage reports that instead), or any section at all when confidence assessment is switched off in configuration. All four are expected on healthy documents — a single blank page or cover sheet produces one — so counting them would breach the alarm’s threshold on ordinary throughput. A section whose named class is missing from the configuration is not in that set and does publish, because the section was expected to hold data and holds none — on the default classification configuration that needs a configuration edit to happen at all, but on the two non-enforcing ones described above it follows model output, so tuneConfidenceUnavailableThresholdto your corpus there. No data therefore means every section that should have been scored was scored — give or take a confidence pass that failed transiently and succeeded on retry.
One alarm publishes to AlertsTopic:
AssessmentConfidenceUnavailableAlarm—ConfidenceUnavailableThreshold(default10) or more degrades within 15 minutes. UnlikeStaleOutputPurgeFailedAlarmthis deliberately does not alarm on the first occurrence: a single degraded section is an expected, self-limiting outcome — one unusually large section against a small-context confidence model produces it with nothing misconfigured. A steady stream is what a systemic cause produces, because it degrades every section of every document. The default assumes no single document legitimately produces ten degrades; raise the parameter if your documents split into many sections that a small-context confidence model cannot fit, since one such document would otherwise fire it on its own. The unified-pattern dashboard draws the configured value as its annotation, so the graph and the trigger stay in step when you tune it.
Diagnosing. Start from the recorded issue’s code, which says whether the
confidence pass failed or never ran, and its root_cause, which names the
underlying exception for a failure and what the section was missing for a skip.
The same line is logged at ERROR in the AssessmentFunction log group. Note
that group is /<StackName>-PATTERNSTACK-<id>/lambda/AssessmentFunction: the name
comes from AWS::StackName inside the nested pattern template, which is the
nested stack’s CloudFormation-generated name, not the root stack’s — so list on the
/<StackName>-PATTERNSTACK prefix rather than typing the path. A failure logs
“Deterministic (non-retryable) assessment failure”; a skip logs what the section
was missing. The six causes worth checking first:
| Symptom in the recorded issue | Likely cause | Fix |
|---|---|---|
ValidationException: Input is too long for requested model. | The confidence model’s input limit is smaller than the sections being assessed | Lower extraction.confidence.list_batch_size, or configure a confidence model with a larger context window |
AccessDeniedException on bedrock:InvokeModel | The configured confidence model is not granted, or model access was revoked | Grant the model in Bedrock console → Model access, and check the Lambda role |
ValidationException naming the model id | The model id is not available in this region | Choose a model enabled in the deployment region |
No exception at all, and the code is assessment_skipped_confidence_unavailable | The section reached assessment with nothing to assess: no extraction result, no pages, or an empty inference_result | Look at the stage that produced the section — Extraction for a missing or empty result, Classification for a section with no pages — not at the confidence model |
The same code, with a root_cause naming a class that is “not in the configuration” | The section’s class was renamed or deleted while documents were in flight, the document was reprocessed under a configuration that no longer defines its class, or the classifier predicted a class outside the vocabulary on a path that does not enforce one. No fields were extracted either — the section carries extraction_class_not_configured too | Add the class to the configuration, reclassify the document under the current one, or turn enforceValidClasses on. Not a confidence problem. If these arrive steadily, check which classification method and enforcement setting you are running before raising ConfidenceUnavailableThreshold |
The same code, with a root_cause saying none of the section’s pages are present in the document | The section lists page IDs the document does not contain, so there was no page text or image to assess against. Before this was detected the pass ran anyway and returned scores derived from nothing | Check the Classification step’s section boundaries and the OCR step’s page list. A warning-severity assessment_pages_missing (no metric) marks the partial case, where only some pages were absent |
What is lost while it is firing: the affected sections have no confidence values, so they are not covered by confidence-based review — HITL confidence routing and the UI threshold signals do not apply to them, and per-field scores are absent in the UI. The extracted data itself is unaffected.
One dashboard widget on the unified pattern dashboard (not the main one): Confidence Assessment Degraded, a 15-minute-period count with the alarm threshold drawn as an annotation so the trend and the trigger are read together.
Agent Transcript Write Failures
Section titled “Agent Transcript Write Failures”The analytics UI replays an agent conversation from agent_messages on the job
record, which is the whole transcript held in one DynamoDB attribute. Appending
a message therefore means reading the array, growing it by one and writing it back,
and every sub-agent in a turn does that against the same record — nothing caps how
many sub-agents a turn may use. Each append is conditional on a version attribute so
an overlapping writer is rejected rather than overwritten, and a rejected append is
rebuilt on a fresh read with jittered backoff. A message that still cannot be stored
after the retry budget is dropped.
Dropping it is the deliberate choice: the alternative is writing the transcript unconditionally, which forces one message through at the cost of every message written since the read. What matters operationally is that the drop is visible, because the unguarded version of this append lost most of a transcript with every individual write reporting success (#1098).
Only the analytics agent records a transcript. AGENT_TABLE is set on exactly two
functions — AgentProcessorFunction, which is this path, and
AgentCoreMCPHandlerFunction, which builds no agent — and a transcript logger also
needs the job_id and user_id that only the analytics entry point passes. Agent chat
stores no transcript, so neither metric below can come from it.
Two metrics in the stack’s own namespace (<StackName>), both published with no
dimensions by DynamoDBMessageLogger in idp_common.agents.common, both from
AgentProcessorFunction, which sets METRIC_NAMESPACE to the root stack name and
whose cloudwatch:PutMetricData grant permits that namespace alongside
IDPControlPlane. They are separate because only one of them means the message is
gone:
AgentTranscriptMessageDropped— value1per message the append gave up on: the conflict retries ran out, or the read kept failing. The message is lost. No data means nothing was dropped.AgentTranscriptDrainIncomplete— one datum per drain that did not finish, carrying the number of messages it left behind, soSumcounts messages. An agent’s close waits two seconds for whatever is still queued; this is what the wait left. The message is not necessarily lost — the wait stops without cancelling, and Lambda resumes unfinished background work if that execution environment is thawed again. No data means every drain finished.
Two alarms publish to AlertsTopic:
AgentTranscriptMessageDroppedAlarm— ten or more dropped messages within 15 minutes. LikeAssessmentConfidenceUnavailableAlarm, and unlikeStaleOutputPurgeFailedAlarm, it deliberately does not fire on the first occurrence: one drop is a tolerated outcome of a bounded retry under a burst and costs a single transcript entry that nothing else depends on. A stream of them means transcripts are being recorded with gaps across the board.AgentTranscriptDrainIncompleteAlarm— ten or more messages left behind within 15 minutes. Volume rather than first occurrence for a weaker reason than its sibling: a single incomplete drain usually costs nothing, because the write resumes on the next thaw. What is worth waking someone for is writes routinely outlasting the agents that queued them.
Diagnosing. The log line beside every emit names the job id and the message’s
role and timestamp, at ERROR in AgentProcessorFunction’s log group. It does not name a
sequence_number, because that value is the message’s position in the stored
transcript and a message that was never stored has none. That log group is not under a
/aws/lambda/<StackName>- prefix you can guess: the function declares no
LogGroupName, so it takes CloudFormation’s generated name and lists on the
<StackName>- prefix with no leading slash. The three causes read differently:
| Log line | Cause | Fix |
|---|---|---|
Gave up appending message ... after N attempts | Sustained contention: many sub-agents writing one job record | Expected under a wide fan-out; if it is steady, look at how many agents the requests select. Selecting every available agent is one click in the UI |
Could not read existing messages ... after N attempts | The read itself kept failing — throughput on the agent table, or a transient service error | Check the agent table’s throttling metrics. A read error that cannot succeed on retry (AccessDeniedException, ValidationException) is not retried and is logged once, so a single warning of that shape points at the grant or the request rather than at load |
Agent transcript write for job ... did not finish within Ns | The agent closed and the bounded drain at its exit could not complete this write in time — a write deep in a retry ladder, or a burst queued behind one. This is the one that feeds AgentTranscriptDrainIncomplete | Check the agent table’s latency and throttling metrics. Unlike the two above, the message may well have been persisted: see below |
What is lost while either alarm is firing: entries in the stored conversation transcript, so a replayed conversation shows gaps. The agent’s own answer to the user, the job’s outcome and every extracted result are unaffected — these metrics watch a path whose failure the workflow reports as success.
The two metrics do not license the same conclusion, which is why they are separate.
AgentTranscriptMessageDropped means the message is gone: the append gave up.
AgentTranscriptDrainIncomplete means only that a write outlived the agent that queued
it. Stopping the wait does not cancel the write, and Lambda resumes unfinished
background work if that execution environment is thawed for another invocation, so the
message frequently is stored — just after the session that was reading the transcript
has moved on. It is lost only if the environment is reclaimed instead of reused, which
is the certain outcome for the last invocation before a scale-down. Folding the two
together would page whoever alarmed on a destroyed transcript every time an environment
froze and thawed.
The drain is what makes the third case bounded and visible at all. Transcript writes are queued on a thread pool, and a Lambda invocation ends with the execution environment being frozen rather than shut down, so nothing flushes that queue on its own — an agent’s context-manager exit waits for it, for two seconds, and reports what it could not finish (#1110).
Log Groups
Section titled “Log Groups”The solution creates centralized logging across all components:
/aws/stepfunctions/IDPWorkflow: Step Function execution logs/aws/lambda/QueueProcessor: Document queue processing logs/aws/lambda/OCRFunction: OCR processing logs and errors/aws/lambda/ClassificationFunction: Classification processing logs/aws/lambda/ExtractionFunction: Extraction processing logs/aws/lambda/TrackingFunction: Document tracking and status logs- The REST API’s access logs and the dispatcher Lambda’s log group: Web UI API activity (the dispatcher is the single entry point for every UI query and mutation)
All logs include correlation IDs for tracing individual document processing journeys.
LogLevel — what WARN turns off
Section titled “LogLevel — what WARN turns off”The LogLevel stack parameter defaults to WARN. At INFO or DEBUG the
accelerator can write S3 presigned URLs, document contents and PII into
CloudWatch Logs, which is why well-architected has
recommended WARN or ERROR for production and why the default was changed from
INFO (AppSec finding #9). An existing stack keeps whatever value it was
deployed with — CloudFormation preserves the previous parameter value on update —
so this only affects new stacks and updates that re-specify the parameter.
Four things you may be used to seeing are absent at WARN, and each comes back
only by setting LogLevel=INFO (or DEBUG) and accepting the exposure above:
- Per-stage progress lines. The
INFOmessages many operators use to follow one document through OCR, classification, extraction and assessment. Errors and warnings are still logged, and document status is still visible in the Web UI and the tracking table. - The Web UI REST API access log. Access logging on the API Gateway stage is
only configured when
LogLevelisINFOorDEBUG(finding API-GW-006). It records request metadata only, never bodies, but it is the only trace of requests that fail before the dispatcher Lambda — authorizer 401/403s, WAF blocks, CORS and gateway responses. This is deliberately coupled toLogLevelrather than given its own parameter, so emitting request metadata stays one visible decision. - The dashboard widget “Count of Workflow Executions over latency threshold”.
It is a Logs Insights query that parses the workflow tracker’s
INFOlinePublishing latency metrics - ... total: <n>ms, so atWARNthe widget is always empty. It is the only dashboard element with this dependency. The underlying data is still published as custom metrics (QueueLatencyMilliseconds,WorkflowLatencyMilliseconds,TotalLatencyMillisecondsin the stack’s metric namespace), which drive the “Queue Latency” and “Workflow Latency” widgets next to it;SlowExecutionsAlarmreads Step Functions’ ownExecutionTimemetric. Neither the metrics nor the alarm depend on the log level, so nothing you would alert on is lost — only that one per-minute count. - Installed features are not affected — they still log at
INFO. Each installable feature (for examplepii-anonymizer) is its own stack, launched with theLogLevelpinned in itsfeature.yaml, which isINFOfor the six shipped features. The host’s value is not forwarded. Change the feature stack’sLogLevelparameter after install if you need it atWARN; newly scaffolded features default toWARN. idp-cli deploy --log-levelhas no CLI default. Omit it to get the template default on a new stack or to preserve the current value on an update. Passing--log-level INFOis honoured; it used to be silently treated as “unset”.
X-Ray Tracing
Section titled “X-Ray Tracing”EnableXRayTracing (default true) controls AWS X-Ray tracing. On true each
covered Lambda runs in Active mode and both state machines set
TracingConfiguration.Enabled; on false the Lambdas run in PassThrough, which
records nothing of their own and continues a trace only if a caller already sampled
the request, and the state machines stop tracing. X-Ray is billed per trace
recorded, so false is how you take that line of the bill to zero.
It covers both state machines and every traced Lambda in the three templates the
main stack deploys: template.yaml, patterns/unified/template.yaml, and the
nested feature-platform/main-stack-extensions/template.yaml, which receives the
parameter from the main stack the same way it receives LogLevel and
LogRetentionDays. scripts/tests/test_xray_tracing.py is what keeps that true —
it fails if any function in those templates hardcodes a mode, and if any function in
the nested one omits it.
⚠️ The feature-platform resolvers are new to the traced set, and on the default
true they add X-Ray charges an existing deployment did not have. Those are the
UI-facing resolvers and install hooks in the nested stack. They declared
Tracing: Active before, but they share one execution role that carried no
xray:PutTraceSegments, so no segment was ever written and nothing was billed —
tracing was on and inert. The role now carries the grant, so with
EnableXRayTracing=true they emit segments like every other traced function in the
deployment, and with false they emit nothing. If you upgrade and want the previous
X-Ray spend, set the parameter to false.
Installed extensions trace unconditionally
Section titled “Installed extensions trace unconditionally”An extension you install from the Extensions catalog — pii-anonymizer,
idp-data-generator, confbench-testset, sample-feature,
sample-health-insurance-review, or a stack scaffolded from feature-template — is
its own CloudFormation stack with its own parameters, launched by you rather than
created by the main stack. The install URL pre-fills only two host-derived values,
MainStackName and FeatureBucket, so the main stack’s EnableXRayTracing does
not reach it, the same way its LogLevel does not (see above). Each of those
templates sets Tracing: Active for every function in its Globals block, so
setting EnableXRayTracing=false on the main stack leaves them tracing.
What that costs depends on the function’s execution role, because SAM attaches the X-Ray write policy only to a role it generates:
| Functions in the six extension templates | Traces recorded |
|---|---|
| Those with a SAM-generated execution role — the majority, and every one that serves requests | Yes — SAM attaches its X-Ray managed policy because Tracing is declared, so these emit segments and are billed |
Those with an explicit Role: — each UiDeployerFunction, plus idp-data-generator’s DockerBuildRunFunction and AgentCoreRuntimeManagerFunction | No — their roles carry no xray:PutTraceSegments, so tracing is declared and produces nothing |
To see the split for the version you are running, rather than trusting a number
written down here, scripts/tests/test_xray_tracing.py’s _traced_without_a_grant
is the predicate: a function it reports has an explicit role that cannot write a
segment, and every other function in those templates emits.
The policy SAM picks depends on the partition: AWSXrayWriteOnlyAccess in aws,
and AWSXRayDaemonWriteAccess in China and GovCloud. Both grant
xray:PutTraceSegments, so the table above reads the same in every partition.
To stop the 13 from tracing today, delete the extension stack, or change
Globals.Function.Tracing in the extension’s template to PassThrough and
republish it. There is no per-extension parameter yet, and adding one is the
obvious third option rather than an unavailable one: all six already declare a
LogLevel parameter with its own default that you set on that stack when you
install it, so an EnableXRayTracing beside it would follow a pattern these
templates already use. What it would not do is make the main stack’s setting reach
them — the catalog install flow pre-fills only MainStackName and FeatureBucket
from the host — so it is a knob per stack, not one setting for the deployment.
scripts/tests/test_xray_tracing.py records these six templates exactly, in both
directions, so a seventh cannot join them silently and converting one forces its
entry to be removed.
Pattern-Specific Monitoring
Section titled “Pattern-Specific Monitoring”Each pattern includes additional monitoring tailored to its specific workflow:
Pattern 1: Bedrock Data Automation (BDA)
Section titled “Pattern 1: Bedrock Data Automation (BDA)”- BDA project execution metrics
- API usage and throttling
- Media processor performance
Pattern 2: Textract + Bedrock
Section titled “Pattern 2: Textract + Bedrock”- Textract OCR performance
- Bedrock model usage
- Classification confidence distribution
- Extraction completeness metrics
Pattern 3: Textract + UDOP + Bedrock
Section titled “Pattern 3: Textract + UDOP + Bedrock”- SageMaker endpoint performance
- UDOP model latency and throughput
- GPU utilization metrics
Alarms the Stack Creates
Section titled “Alarms the Stack Creates”Every alarm publishes to one SNS topic, AlertsTopic. A standard deployment
subscribes the AdminEmail address to it at deploy time — but that subscription
is not live until the address confirms it, and one address is not an on-call
rota. A --headless deployment subscribes nothing, because the transform
removes the AdminEmail parameter along with the UI, so there setting up delivery
is a required step you perform yourself. Read
Who receives the alerts before assuming these alarms
will reach anyone, in either mode.
⚠️ On stacks deployed before release 0.6.7 with the circuit breaker disabled (the default), no alarm notification was ever delivered.
AlertsTopicis always encrypted with the stack’s customer-managed key, but the key policy statement granting CloudWatch permission to use it was conditional onCircuitBreakerEnabled=true. With the defaultfalse, every alarm action failed with “CloudWatch Alarms does not have authorization to access the SNS topic encryption key” — visible only in each alarm’s Actions history, since the alarm itself still transitioned toALARMin the console. The grant is now unconditional. If you upgrade a stack that has been alarming silently, expect notifications to start arriving; to confirm, checkaws cloudwatch describe-alarm-history --alarm-name <name> --history-item-type Actionbefore and after.
All of them set TreatMissingData: notBreaching, so an idle stack reads OK
rather than INSUFFICIENT_DATA. That is deliberate: for these signals “no
documents processed” genuinely means “no failures”, and leaving alarms parked in
INSUFFICIENT_DATA makes a broken alarm indistinguishable from a quiet one
(see the WorkflowErrorsAlarm note below).
| Alarm | Fires when | Topic | Tuned by |
|---|---|---|---|
WorkflowErrorsAlarm | Failed Step Functions executions ≥ threshold in 5 min | AlertsTopic | ErrorThreshold (default 1) |
SlowExecutionsAlarm | Average execution time exceeds the threshold over 5 min | AlertsTopic | ExecutionTimeThresholdMs (default 300000, i.e. 300 s) |
WorkflowTimeoutsAlarm | Any execution ended TIMED_OUT by the execution-level bound in 5 min | AlertsTopic | Threshold is fixed (≥ 1); the bound itself is WorkflowExecutionTimeoutSeconds (default 21600, i.e. 6 hours) |
ConcurrencyCounterDriftAlarm | Concurrency drift > 0 sustained for 15 min | AlertsTopic | — |
ConcurrencyCounterUnderflowAlarm | Any decrement refused because the counter was already 0 — a slot released twice | AlertsTopic | — |
ConcurrencyCounterNegativeAlarm | Concurrency counter observed below 0 in 5 min — the ceiling is being exceeded | AlertsTopic | — |
DocumentQueueDLQAlarm | Any message in the document DLQ — a document that failed every retry | AlertsTopic | — |
QueueSenderDLQAlarm | Any message in the queue-sender DLQ — an upload that was never enqueued | AlertsTopic | — |
DocumentQueueStalledAlarm | Oldest queued document older than the threshold and nothing left the queue, for 30 min | AlertsTopic | QueueStalledAgeThresholdSeconds (default 1800, i.e. 30 min) |
QueueProcessorErrorsAlarm | Any QueueProcessor invocation error in 5 min — for this function, a timeout or out-of-memory before its SQS batch finished | AlertsTopic | — |
WorkflowTrackerDLQAlarm | Any message in the Workflow Tracker DLQ | AlertsTopic | — |
StaleOutputPurgeFailedAlarm | Any output-purge failure within 5 min | AlertsTopic | — |
AssessmentConfidenceUnavailableAlarm | ConfidenceUnavailableThreshold or more sections left with “no confidence scores” within 15 min, whether the confidence pass failed or never ran — something systemic, not a few awkward documents | AlertsTopic | ConfidenceUnavailableThreshold (default 10) |
AgentTranscriptMessageDroppedAlarm | Ten or more agent conversation messages dropped from the stored transcript within 15 min — sustained write contention on one job record, or reads that keep failing. These messages are gone | AlertsTopic | — |
AgentTranscriptDrainIncompleteAlarm | Ten or more transcript writes left unfinished within 15 min when the agents that queued them closed. Distinct from the row above: these writes were not cancelled and often complete on the next thaw, so the transcript may be late rather than incomplete | AlertsTopic | — |
DataMartRollupDLQAlarm | Any message in the reporting-rollup DLQ | AlertsTopic | — |
BedrockServiceOutageAlarm | Combined Bedrock error count exceeds the circuit-breaker threshold | CircuitBreakerTopic | CircuitBreakerFailureThreshold and the CircuitBreakerTrigger* toggles |
AlertsTopic carries the display name Workflow Alerts.
BedrockServiceOutageAlarm is created only when the circuit breaker is enabled
and reports to its own topic, since it drives automated back-off rather than
human attention — the circuit-breaker manager Lambda that topic invokes then
publishes a readable notification to AlertsTopic, so a breaker trip still
reaches the same recipients.
Who receives the alerts
Section titled “Who receives the alerts”A standard deployment creates an email subscription on AlertsTopic for the
address you passed as the AdminEmail parameter — the same address that receives
the temporary Cognito password. Before release 0.6.9 there was no subscription to
AlertsTopic — other topics in the solution had one, this one did not: the topic
ARN was emitted as the SNSAlertsTopicARN stack output and an
operator was tacitly expected to subscribe by hand, so a default deployment
raised alarms nobody saw (issue #922).
Headless deployments: you set up alert delivery
Section titled “Headless deployments: you set up alert delivery”⚠️ A
--headlessdeployment creates no subscription onAlertsTopic, so alarm delivery is a required post-deployment step. The headless transform removes theAdminEmailparameter along with the Web UI and Cognito resources, and a subscription cannot reference a parameter that does not exist, so the subscription is removed with it. The topic and every alarm are still created, andSNSAlertsTopicARNis still a stack output — what is missing is a recipient.
This is a deliberate decision rather than an oversight, and the reasoning is worth
stating because the alternative looks obviously better until you consider who
deploys this way. Headless is the API-only path: operators using it are automating,
and most of them attach a pager, a chat webhook or an existing operational topic
through their own infrastructure-as-code. An optional AlertsEmail parameter on the
variant whose design goal is fewer moving parts would be a parameter most of them
never set, while the ones who do want email are equally well served by one
aws sns subscribe call they already have to make for their other topics. What is
not acceptable is finding out by missing an alarm, which is why this is called
out here, in
Headless Deployment and in
GovCloud Operations rather than left
to be inferred from the template. Tracked and decided in
issue #984.
Do it immediately after the stack completes:
TOPIC_ARN="$(aws cloudformation describe-stacks --stack-name <stack-name> \    --query "Stacks[0].Outputs[?OutputKey=='SNSAlertsTopicARN'].OutputValue" \    --output text)"
# Email or a distribution list — starts in PendingConfirmation, see below.aws sns subscribe --topic-arn "$TOPIC_ARN" \  --protocol email --notification-endpoint ops-alerts@example.com
# Or an endpoint with no confirmation step and no unsubscribe link in the payload,# which is the better choice for an automated deployment.aws sns subscribe --topic-arn "$TOPIC_ARN" \  --protocol https --notification-endpoint https://example.com/hooks/idp-alerts
Then verify with the list-subscriptions-by-topic command below. Treat a topic
with zero subscriptions as a failed deployment step: every alarm will publish
successfully and notify nobody, and nothing in the stack, the console or the alarm
history will tell you.
You must confirm the subscription before anything is delivered
Section titled “You must confirm the subscription before anything is delivered”⚠️ An SNS email subscription starts in
PendingConfirmationand delivers nothing at all until the recipient clicks the confirmation link. SNS sends a “AWS Notification - Subscription Confirmation” message toAdminEmailwhen the stack is created. Until someone opens it and follows the link, every alarm still publishes successfully and every notification is still dropped — which looks exactly like the pre-0.6.9 behaviour. A pending confirmation does not fail or delay the CloudFormation operation, so there is no deployment error to notice; the confirmation token is valid for about two days, after which you have to re-request one from the SNS console.
Check the status any time:
aws sns list-subscriptions-by-topic \ --topic-arn "$(aws cloudformation describe-stacks --stack-name <stack-name> \ --query "Stacks[0].Outputs[?OutputKey=='SNSAlertsTopicARN'].OutputValue" \ --output text)" \ --query 'Subscriptions[].{Protocol:Protocol,Endpoint:Endpoint,Arn:SubscriptionArn}' \ --output tableA SubscriptionArn of the literal string PendingConfirmation means exactly
that — unconfirmed, delivering nothing. A real ARN means the endpoint is live.
Alert a team, not one person
Section titled “Alert a team, not one person”One personal mailbox is a single point of failure for every alert in the
solution. The AdminEmail subscription is a floor, not a design: add the
recipients you actually want to the same topic. These are ordinary SNS
subscriptions and are independent of the stack, so adding them does not conflict
with a stack update, and removing the stack removes only the subscription it
created.
There is a second reason beyond the rota. Every SNS email carries a one-click
unsubscribe link, so any recipient — or anyone the mail is forwarded to — can
remove the subscription without telling you, and nothing in the stack notices.
Alarms then keep publishing successfully to a topic nobody receives, which is
indistinguishable from having no subscription at all. This is inherent to
Protocol: email rather than something this solution introduces, and it is the
strongest argument for the options below: a chat or https subscription has no
unsubscribe link in the payload, and a distribution list keeps the SNS endpoint
constant no matter who leaves it. If you rely on email, re-run the
list-subscriptions-by-topic check above periodically.
-
A distribution list or ticket queue — subscribe a group address rather than an individual, so the rota changes without a stack update:
Terminal window aws sns subscribe --topic-arn <alerts-topic-arn> \--protocol email --endpoint idp-oncall@example.comEvery email subscription needs its own confirmation click, including this one.
-
Chat — AWS Chatbot subscribes the topic to a Slack channel or Amazon Chime/Microsoft Teams room and renders the alarm payload legibly. No confirmation step, and the channel history gives you an audit trail that a mailbox does not.
-
Paging — PagerDuty, Opsgenie and similar accept an SNS
httpssubscription endpoint, which is confirmed automatically by the receiving service. Use this if an alarm needs to wake someone; email will not. -
An existing operational topic — if you already centralise alarms, you do not have to use
AlertsTopicas the fan-out point. Subscribe your own topic’s ingest Lambda/queue to it, or point the alarms at your topic directly by editingAlarmActionsin a template you deploy yourself. A subscriber in another account needssns:Subscribeon the topic policy. It does not need any permission on the stack’s KMS key: SNS server-side encryption protects the message at rest and SNS decrypts it itself before delivery, so the documented key-policy grants are for publishers and for thesns.amazonaws.comservice principal, not for subscribers. The KMS requirement that does exist runs the other way — if you subscribe an encrypted SQS queue, that queue’s key policy must allowsns.amazonaws.comtokms:GenerateDataKey*andkms:Decrypt, otherwise delivery fails silently from SNS’s side.⚠️ Do not grant a foreign account
kms:Decrypton the stack’sCustomerManagedEncryptionKeyin order to receive alerts. That one key also encrypts the input, output, working and evaluation buckets, the DynamoDB tables and the queues, so the grant would reach the entire processed-document corpus — an enormous amount of access for an alarm email, and it is not required.
--headless deployments still start with no subscribers
Section titled “--headless deployments still start with no subscribers”⚠️ A
--headlessdeployment strips theAdminEmailparameter along with Cognito, so it collects no operator address and creates no subscription at all. It keepsAlertsTopicand all fifteen alarms, so a headless stack still has the original defect: every alarm publishes successfully and nobody is notified. Issue #922 is closed for the standard deployment and remains open for this one.
Subscribing at least one recipient to the SNSAlertsTopicARN output is therefore
a required post-deploy step for headless, not an optional improvement:
aws sns subscribe --topic-arn <alerts-topic-arn> \ --protocol email --endpoint idp-oncall@example.comWhether the headless variant should gain its own optional alerts-email parameter is an open deployment-interface question rather than a defect in the transform.
WorkflowErrorsAlarm — the primary failure signal
Section titled “WorkflowErrorsAlarm — the primary failure signal”ErrorThreshold defaults to 1, so this is an alert on any failed
execution rather than on a rate. That matches document processing, where each
failed execution is a document that did not get processed; a percentage
threshold would stay silent on a low-volume day when everything failed. Raise
ErrorThreshold if you routinely submit documents you expect to fail (malformed
uploads, for instance) and only want to hear about clusters.
Note that this counts failed executions. A document that fails in a way the
state machine catches and handles finishes as a successful execution, so it
does not appear here — use the Processing Issues column in the Web UI and the
Processing Report for those. ExecutionsTimedOut is a separate metric, covered by
WorkflowTimeoutsAlarm (below); ExecutionsAborted is not covered by any alarm.
⚠️ Before release 0.6.7 this alarm never fired. It was defined against
ExecutionsFailedCount, which is not a metric Step Functions publishes, so it received no datapoints and stayed inINSUFFICIENT_DATAthrough real failures (#746). If you upgrade a stack that has been failing silently, expect notifications to start arriving immediately — that is the fix working, not a new problem.
SlowExecutionsAlarm — check the threshold against your documents
Section titled “SlowExecutionsAlarm — check the threshold against your documents”This compares the average execution time over 5 minutes against
ExecutionTimeThresholdMs. The 300-second default suits small documents; large
packets, agentic extraction, and summarization all routinely exceed it, so a
deployment that processes those should raise the parameter or the alarm will
report normal operation as a problem. Because it is an average, one slow document
in a busy 5-minute window will not trip it — this is a “the whole pipeline is
slow” signal, not a per-document one.
The queue alarms — the gap both of the above leave
Section titled “The queue alarms — the gap both of the above leave”Both alarms above read the state machine, so neither can see a document that
never got an execution (#761):
a dead-lettered document emits no ExecutionsFailed, and a document still sitting
in the queue emits no ExecutionTime. Four alarms cover the queue layer.
DocumentQueueDLQAlarm and QueueSenderDLQAlarm
Section titled “DocumentQueueDLQAlarm and QueueSenderDLQAlarm”Both fire on the first message, with no threshold to tune, and both also
notify on recovery (OKActions) — DLQ depth does not decay on its own, so the
OK notification is how you know someone actually drained the queue.
WorkflowTrackerDLQAlarm now does the same, so all three DLQ lines on the
Dead-Letter Queue Depth widget behave alike.
| Alarm | What a message means | Recovery |
|---|---|---|
DocumentQueueDLQAlarm | The document exhausted DocumentQueue’s redrive policy — maxReceiveCount 500 against a 60 s visibility timeout, roughly 8 hours of retries — and never processed. | Read the messages for the object keys, find the cause in the QueueProcessor and state-machine logs, then redrive or re-upload. Redrive needs kms:Decrypt on the stack’s CMK. |
QueueSenderDLQAlarm | The upload event never reached the queue, so the document never entered the pipeline. | Read the messages for the S3 keys, check the QueueSender logs, then re-upload. See the note below on which state the document is left in — and note that SQS redrive does not apply to this queue. |
What a
QueueSenderDLQmessage means for the document, precisely. The queue sender writes the tracking record before it enqueues (src/lambda/queue_sender/index.py), so where the invocation died decides what you see: a failed enqueue leaves a row wedged atQUEUEDin the Web UI forever, while a failedcreate_documentleaves no record at all. Look for the stuckQUEUEDdocument first — that is the likelier case in a queue named for the sender. Recovery is re-upload either way:QueueSenderDLQis a Lambda async-invoke DLQ, not the dead-letter queue of another SQS queue, soStartMessageMoveTask(the console’s Redrive button) does not apply to it and is not offered.DocumentQueueDLQis a true SQS DLQ, so redrive does work there.
QueueProcessorErrorsAlarm — a processor that cannot finish its batches
Section titled “QueueProcessorErrorsAlarm — a processor that cannot finish its batches”QueueProcessor catches every per-message error itself, so an invocation that
ends in a Lambda error is one that was killed from outside: it hit its
Timeout or ran out of memory before finishing its SQS batch. Nothing else
reports that. The messages it held are redelivered and eventually processed, so
every execution still succeeds, the DLQ stays empty and DocumentQueueStalledAlarm
sees a queue that is draining. Before release 0.6.9 this was how a saturated
queue silently multiplied its own work
(#904):
the processor ran at the 128 MB default with 50-message batches and a 30 s
timeout, two thirds of its invocations under load timed out, and because Lambda
reports a batch outcome only when the function returns, each timeout handed the
whole batch back to SQS — including messages whose StartExecution had already
succeeded. Each redelivery then started another execution, because executions had
no name. One upload was started six times; 4,384 uploads produced 14,727
executions, all billed, with every alarm reading OK.
Two changes make a redelivery harmless now, whatever Lambda or SQS do: the
execution name is derived from the SQS message id (<basename>-<message-id>),
so a second start of the same message is refused by Step Functions and acked as a
no-op, and each message is deleted the moment its execution exists rather than at
the end of the batch. The processor also runs at 1024 MB with 10-message batches
and a 60 s timeout, so the timeouts themselves should be rare. When this alarm
does fire, compare the function’s Duration and Max Memory Used against
its Timeout and MemorySize, and check Throttles: a processor that cannot
finish 10 messages in 60 s is undersized for the deployment’s configuration (a
very large merged configuration is decompressed per message) or is being
throttled. To confirm redelivery rather than duplicate ingest for one document,
count receives of its message in the QueueProcessor log group — a single
messageId appearing more than once is a redelivery, and since 0.6.9 the same id
is the suffix of the execution name:
fields @timestamp, @requestId, @message| filter @message like /Processing message/ and @message like /<object-key>/| sort @timestamp ascDocumentQueueStalledAlarm — why it is not a queue-depth alarm
Section titled “DocumentQueueStalledAlarm — why it is not a queue-depth alarm”“Not draining” cannot be alarmed on queue depth, because waiting is the design: the queue processor refuses a message by letting its visibility timeout lapse while workflow concurrency is saturated.
It cannot be alarmed on message age alone either, and that is less obvious.
Because a refused message is never deleted and re-sent,
ApproximateAgeOfOldestMessage measures time since the original send, so it
climbs monotonically for as long as concurrency stays saturated — a healthy stack
draining a large batch will pass any fixed age threshold.
So the alarm requires both conditions in one metric-math expression: the
oldest message is older than QueueStalledAgeThresholdSeconds and not a
single message was deleted in the period. Deep but draining stays OK at any
depth; a wedged consumer fires.
Why the window is 30 minutes (six 5-minute periods, where the other alarms
here use one to three). A message leaves DocumentQueue only when a workflow
slot frees up, so with concurrency saturated by long-running documents a
healthy stack can legitimately delete nothing for as long as its slowest
document takes. A shorter window would page on ordinary large-packet
processing — and an alarm that cries wolf gets muted, which costs more than the
detection latency. Thirty minutes of zero dequeues is where “slow” and
“stuck” stop being distinguishable from outside, and it deserves attention
either way: at that point it is either a wedge or a capacity shortfall.
Expect roughly an hour of detection latency at the defaults, not 30 minutes:
the age condition has to be met first (30 minutes at the default threshold) and
the 30-minute no-progress window then runs on top of it. Lower
QueueStalledAgeThresholdSeconds to shorten that, at the cost of firing during
saturation.
A circuit-breaker pause trips this alarm too, by design. A processor in the
OPEN state pushes a message’s visibility out to
CircuitBreakerRecoveryTimeoutSeconds without deleting it, so age climbs and
deletions stay at zero — both conditions hold. That is not suppressed, because
muting the queue signal for the duration of a Bedrock outage would mute it
exactly when documents pile up. If BedrockServiceOutageAlarm is active on the
same topic, this alarm is reporting the same incident and clears on its own when
the breaker closes. Only relevant when the circuit breaker is enabled, which is
not the default.
A failure to read the breaker’s state trips it too, and looks nothing like the
pause above. With CircuitBreakerEnabled=true, a transient fault on the state read
refuses admission, which holds messages without deleting them — so both conditions hold
again. The distinguishing signal is that this case emits no Bedrock error metrics at
all, so BedrockServiceOutageAlarm stays clear and the runbook’s “if that alarm is
also active, it is the same incident” test does not apply. Check the
CircuitBreakerCheckFailed metric with dimension Classification=TRANSIENT; the cause is
the ConcurrencyTable, not the processor and not Bedrock. See
Circuit breaker.
One reporting caveat. SQS stops publishing queue metrics for a queue that has
been inactive for about six hours. In the specific case where the consumer is
fully detached and no new documents arrive, FILL(m1, 0) then yields 0, the
condition goes false, and the alarm returns to OK while the queue is still
stuck. It will have fired first, so the notification is not lost — but do not
read a later OK as “resolved” without checking the queue.
Tuning. Raise QueueStalledAgeThresholdSeconds (default 1800) if bulk
uploads against a low MaxConcurrentWorkflows trip it and you consider that
normal. Because the alarm already requires zero throughput, the threshold is
“how long is too long to wait with no progress whatsoever”, not a backlog limit.
When it fires, check in this order: the Workflow Concurrency Counter
widget (a counter pinned at MaxConcurrentWorkflows with nothing running is a
leaked slot — ConcurrencyCounterDriftAlarm covers that case), the
circuit-breaker state, whether the QueueProcessor event-source mapping is still
enabled, then QueueProcessor invocations, errors, and throttles. If executions
are running and each simply takes longer than 30 minutes, this is a capacity
signal rather than a fault: raise MaxConcurrentWorkflows, or raise the
threshold to accept it.
WorkflowExecutionTimeoutSeconds — the execution-level bound
Section titled “WorkflowExecutionTimeoutSeconds — the execution-level bound”The state machine has a top-level TimeoutSeconds, sourced from the
WorkflowExecutionTimeoutSeconds parameter (default 21600, 6 hours). It is the
backstop for anything the per-state guards do not cover — a Map branch that
stalls rather than errors, a retry policy whose cumulative backoff runs for hours,
a future state added without its own bound. Without it a Standard workflow’s ceiling
is one year, during which the execution emits neither ExecutionsFailed (so
WorkflowErrorsAlarm cannot see it) nor ExecutionTime (so SlowExecutionsAlarm
cannot either), while holding a workflow-concurrency slot: a stack can lose capacity
with every alarm reading OK.
Tripping the bound ends the execution TIMED_OUT. That is a distinct Step
Functions metric, ExecutionsTimedOut, which WorkflowTimeoutsAlarm watches (any
occurrence in 5 minutes); the execution-status EventBridge rule already routes
TIMED_OUT to the workflow tracker, which releases the concurrency slot and marks the
document FAILED with WorkflowStatus TIMED_OUT (visible in the tracking table and
the Web UI), so a timeout is distinguishable from an ordinary failure. The dashboard’s
Workflow Executions widget plots timed-out executions alongside failed ones. A
timed-out execution discards its completed work (OCR, extraction,
assessment, summarization already done), so the default errs generous.
How the default was chosen (measured 2026-09-11 on a production stack, 30 days,
2,253 executions): median execution 0.7 minutes, p90 4.6 minutes, longest
successful execution 37 minutes. Every execution longer than an hour — 117 of them —
was a FAILED run of 306–308 minutes: a single state’s Lambda Sandbox.Timedout at
900 seconds retried eight times at 2.5× backoff. A benchmark stack’s longest success
was 2.6 minutes. Six hours is therefore about ten times the longest observed success.
That particular storm can no longer happen: every Lambda task state now retries the timeout codes at most once, so a deterministic timeout fails in about 30 minutes rather than 5.1 hours (see Step Functions Retry Configuration). The measurement is kept here because it is what sized the bound, and because the transient ladder is unchanged — a state throttled through all eight attempts still spends about 2.8 hours in backoff alone.
Be precise about what the default does and does not bound. It does not shorten
a state that is still inside its own Retry budget: a full transient ladder fails
on its own inside the 6-hour bound, and cutting the bound to 3 hours or less
(10800) is a defensible choice for a stack whose largest documents finish well
under an hour. What the default does bound is everything the
per-state guards cannot: a .waitForTaskToken callback that never arrives once the
BDA bound is exceeded (see below), a state that hangs without erroring, and a storm
that compounds across two or more states (two consecutive transient ladders are
about 5.6 hours).
Not measured: multi-hundred-page packets under agentic table extraction, which are
the case most likely to approach the bound — if your ExecutionTime p99 for
successful runs is within a factor of two of the bound, raise it (up to one year,
31536000, which effectively disables it).
BDACallbackTimeoutSeconds — why a hung BDA job needs its own bound
Section titled “BDACallbackTimeoutSeconds — why a hung BDA job needs its own bound”This one is a parameter rather than an alarm, but it belongs here because without it neither alarm above can see the failure it prevents.
It must also stay smaller than WorkflowExecutionTimeoutSeconds (default 2 hours
against 6) to have any effect: if the BDA bound is the larger of the two, the
execution-level bound fires first and the document simply ends TIMED_OUT, instead of
the BDA step failing with a catchable States.Timeout that the pipeline can record.
In BDA mode (use_bda: true) the BDA_InvokeDataAutomation step uses the Step
Functions .waitForTaskToken integration: it blocks until something outside the
state machine returns the token. The return path is
BDA job → EventBridge (BDAEventRule) → BDACompletionFunction → task token
read from S3 → SendTaskSuccess. Any hop can break — a stuck BDA job, a lost
token, a dropped EventBridge delivery, the completion handler erroring before it
responds.
Before release 0.6.7 that step had no TimeoutSeconds, so a broken callback left
the execution waiting indefinitely, and that is the worst possible shape for
monitoring:
- it never fails, so it emits no
ExecutionsFailed→WorkflowErrorsAlarmis blind; - it never completes, so it emits no
ExecutionTime→SlowExecutionsAlarmis blind; - it holds a workflow-concurrency slot and its tracking row the whole time.
A stack could therefore lose capacity with every alarm reading OK. The step is
now bounded by BDACallbackTimeoutSeconds (default 7200, i.e. 2 hours), and
because the step catches States.ALL and routes to the fail state, tripping the
bound produces a genuinely FAILED execution — which emits ExecutionsFailed,
fires WorkflowErrorsAlarm, and lets the workflow tracker release the
concurrency slot and mark the document FAILED. A stuck document becomes an
ordinary, visible failure.
Tuning. The asymmetry favours a generous value: too high only delays
detection of a job that is already lost, whereas too low fails healthy work and
wastes the BDA spend already incurred. Raise it if you process very large packets
and see States.Timeout failures on documents that were progressing normally. A
timeout is deliberately not retried — re-invoking would start a second BDA
job, paying twice and risking double-processing, for a callback that may still be
in flight.
Pipeline mode is unaffected. Those steps are direct Lambda invocations with their own function timeouts plus
Retry/Catch, so they cannot hang: a failure propagates toExecutionsFailedon its own.
Setting Up Alerts
Section titled “Setting Up Alerts”For who receives the built-in alarms — and the confirmation click that has to happen before any of them are delivered — see Who receives the alerts.
Beyond the built-in alarms you can add your own for metrics specific to your deployment:
- Error Rate Thresholds: Alert when error rates exceed acceptable levels
- Processing Time Anomalies: Detect unusual latency spikes
- Concurrency Limits: Notify when approaching service limits
- Cost Controls: Alert on unusual model usage patterns
Queue backlog and DLQ depth are already covered by the built-in alarms above, and
a plain “depth > N” alarm on DocumentQueue is specifically not worth adding
— see DocumentQueueStalledAlarm
for why depth alone is not a fault signal in this architecture.
Example alarm configuration:
ErrorRateAlarm: Type: AWS::CloudWatch::Alarm Properties: AlarmDescription: Alert when error rate exceeds 5% MetricName: DocumentProcessingErrors Namespace: AWS/Lambda Statistic: Sum Period: 300 EvaluationPeriods: 1 Threshold: 5 ComparisonOperator: GreaterThanThreshold TreatMissingData: notBreaching AlarmActions: - !Ref AlertSNSTopicLog Insights Queries
Section titled “Log Insights Queries”The solution includes predefined CloudWatch Log Insights queries for common analysis tasks:
Error Analysis
Section titled “Error Analysis”filter @message like /ERROR/ or @message like /Exception/| parse @message "Error: *" as errorMessage| stats count(*) as errorCount by errorMessage| sort by errorCount desc| limit 10Processing Time Analysis
Section titled “Processing Time Analysis”filter @message like /Processing complete/| parse @message "Processing complete in * ms" as processingTime| stats avg(processingTime) as avgTime, min(processingTime) as minTime, max(processingTime) as maxTime by bin(30m)| sort by avgTime descDocument Volume Tracking
Section titled “Document Volume Tracking”filter @message like /Document received/| stats count(*) as documentCount by bin(1h)| sort by bin(1h) ascMetric Dimensions
Section titled “Metric Dimensions”Key metrics are available with these dimensions:
- DocumentType: Break down metrics by document class
- ProcessingPattern: Compare metrics across different patterns
- PageCount: Analyze performance based on document complexity
- Region: Track regional performance differences
Performance Benchmarks
Section titled “Performance Benchmarks”The dashboard includes performance benchmark comparisons:
- Current vs. Historical Performance: Compare current metrics against previous periods
- Pattern Comparison: Side-by-side comparison of different processing patterns
- Model Performance: Comparison of different Bedrock models for similar tasks
Operational Monitoring
Section titled “Operational Monitoring”The solution provides operational metrics for infrastructure health:
- Lambda Concurrency: Track function concurrency usage
- Throttling Events: Monitor service limits and throttling
- DynamoDB Capacity: Track consumed read/write capacity units
- S3 Request Rates: Monitor bucket operation rates and latency
- Step Functions Execution Metrics: Track state transitions and execution counts
Cost Monitoring
Section titled “Cost Monitoring”Monitor resource usage and costs:
- Bedrock Model Tokens: Track token usage by model and operation
- Lambda Execution Time: Monitor function duration and memory usage
- S3 Storage: Track storage growth over time
- Data Transfer: Monitor network costs between services
Custom Dashboard Creation
Section titled “Custom Dashboard Creation”You can create custom dashboards focused on specific aspects:
- Open the CloudWatch console
- Go to Dashboards and select “Create dashboard”
- Add widgets using metrics from the “GenAIIDP” namespace
- Organize widgets logically by processing stage or metric type
Exporting Metrics
Section titled “Exporting Metrics”To export metrics for external analysis:
-
Use CloudWatch Metric Streams to send metrics to:
- Amazon Kinesis Data Firehose
- Third-party monitoring tools
- Custom analytics solutions
-
Configure the stream with:
- Metrics namespace filters
- Output format (JSON or OpenTelemetry)
- Destination configuration