What you can run
GCO runs accelerated and CPU workloads of most shapes: batch jobs, gang-scheduled distributed training, Ray clusters, Slurm workloads, multi-region inference endpoints, and multi-step DAG pipelines. Every category below ships with a ready-to-submit manifest in examples/.
Schedulers for every workload pattern
GCO ships six scheduling and orchestration tools — KEDA, Volcano, KubeRay, and Kueue enabled by default, Slurm (Slinky) and YuniKorn opt-in:
- Volcano — gang scheduling for distributed training
- Kueue — resource quotas, fair sharing, priority admission
- KubeRay — Ray clusters for distributed computing and hyperparameter tuning
- KEDA — event-driven autoscaling and scale-to-zero (SQS and 60+ sources)
- Slurm (Slinky) — sbatch/srun workflows and HPC migration
- YuniKorn — multi-tenant queues and hierarchical quotas
They operate at different layers (admission, scaling, pod scheduling, node provisioning) and can be combined — the Schedulers Overview has the comparison table, the decision guide, and the GPU-quota coordination warning you should read before enabling several at once. The scheduler set is not the whole Helm-managed ecosystem: workload operators ship alongside it, most notably Kubeflow Trainer v2 for distributed training (on by default, covered next).
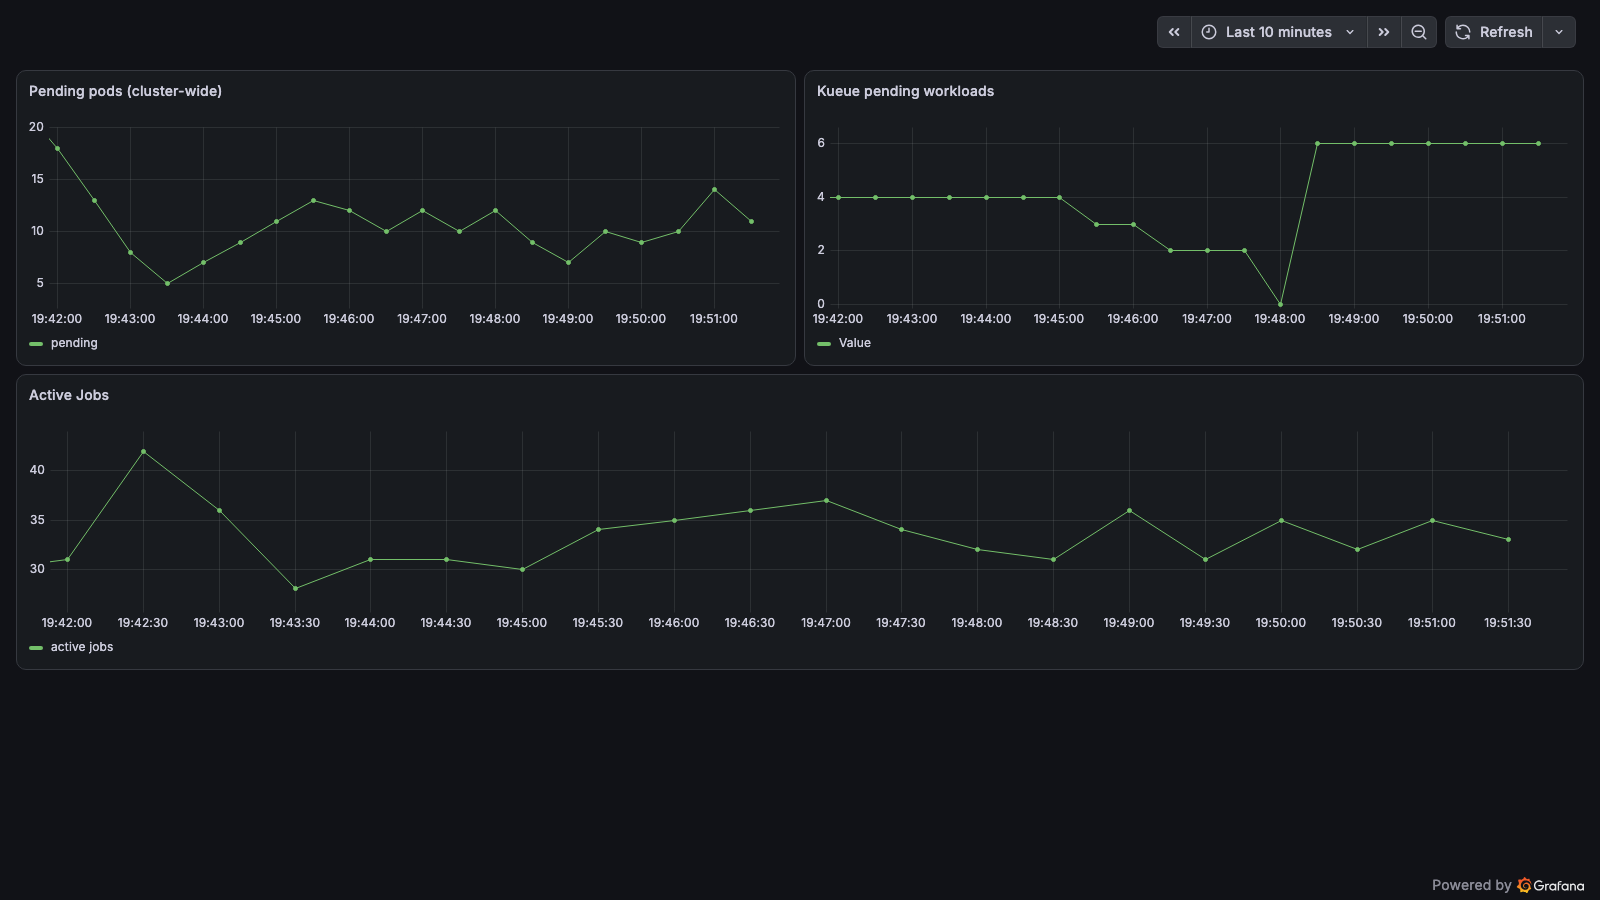
The shipped Grafana Schedulers and Queues dashboard: pending pods, Kueue workloads, and active Jobs.
Distributed training
Kubeflow Trainer v2 is included and enabled by default: you submit a
TrainJob, and the trainer compiles it into a JobSet with the correct
torchrun rendezvous wiring, indexed pods, and restart semantics. TrainJobs
pass the same security validation pipeline as every other submission. Plain
Kubernetes Jobs, hand-rolled indexed Jobs, and EFA-enabled multi-node
training are all supported alternatives — see
docs/DISTRIBUTED_TRAINING.md.
Inference serving
Deploy endpoints to one or more regions with a single command: vLLM, TGI, Triton, TorchServe, and SGLang work out of the box, with model weights synced automatically from S3 to each region. Desired state lives in DynamoDB with continuous reconciliation, so rolling updates, scaling, and stop/start never lose configuration. Disaggregated prefill/decode serving (Mooncake), streaming responses, canary deployments, and spot GPUs are all covered in docs/INFERENCE.md.
Observability, cost, and experiment tracking
Per-cluster Prometheus + Grafana ships on by default (reached privately via
gco monitoring open), with dashboards for services, schedulers, KEDA,
GPU/DCGM telemetry, and cost:
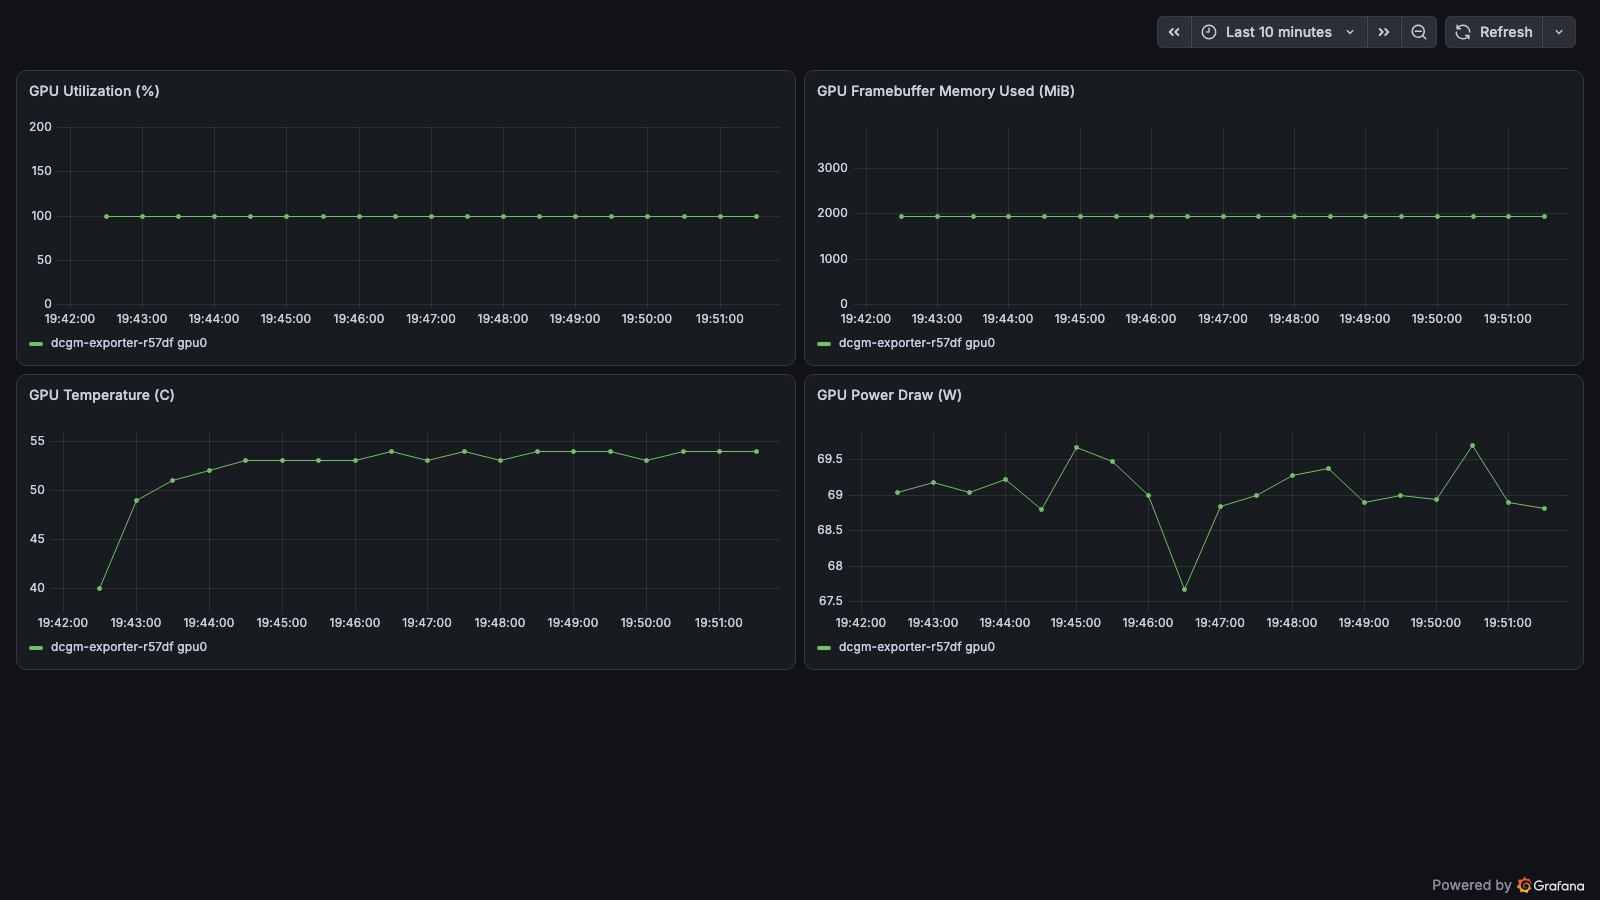
The GPU (DCGM) dashboard: per-GPU utilization, framebuffer memory, temperature, and power draw.
Cost monitoring pairs per-cluster OpenCost with scheduled Parquet reports and cross-region Athena analytics:
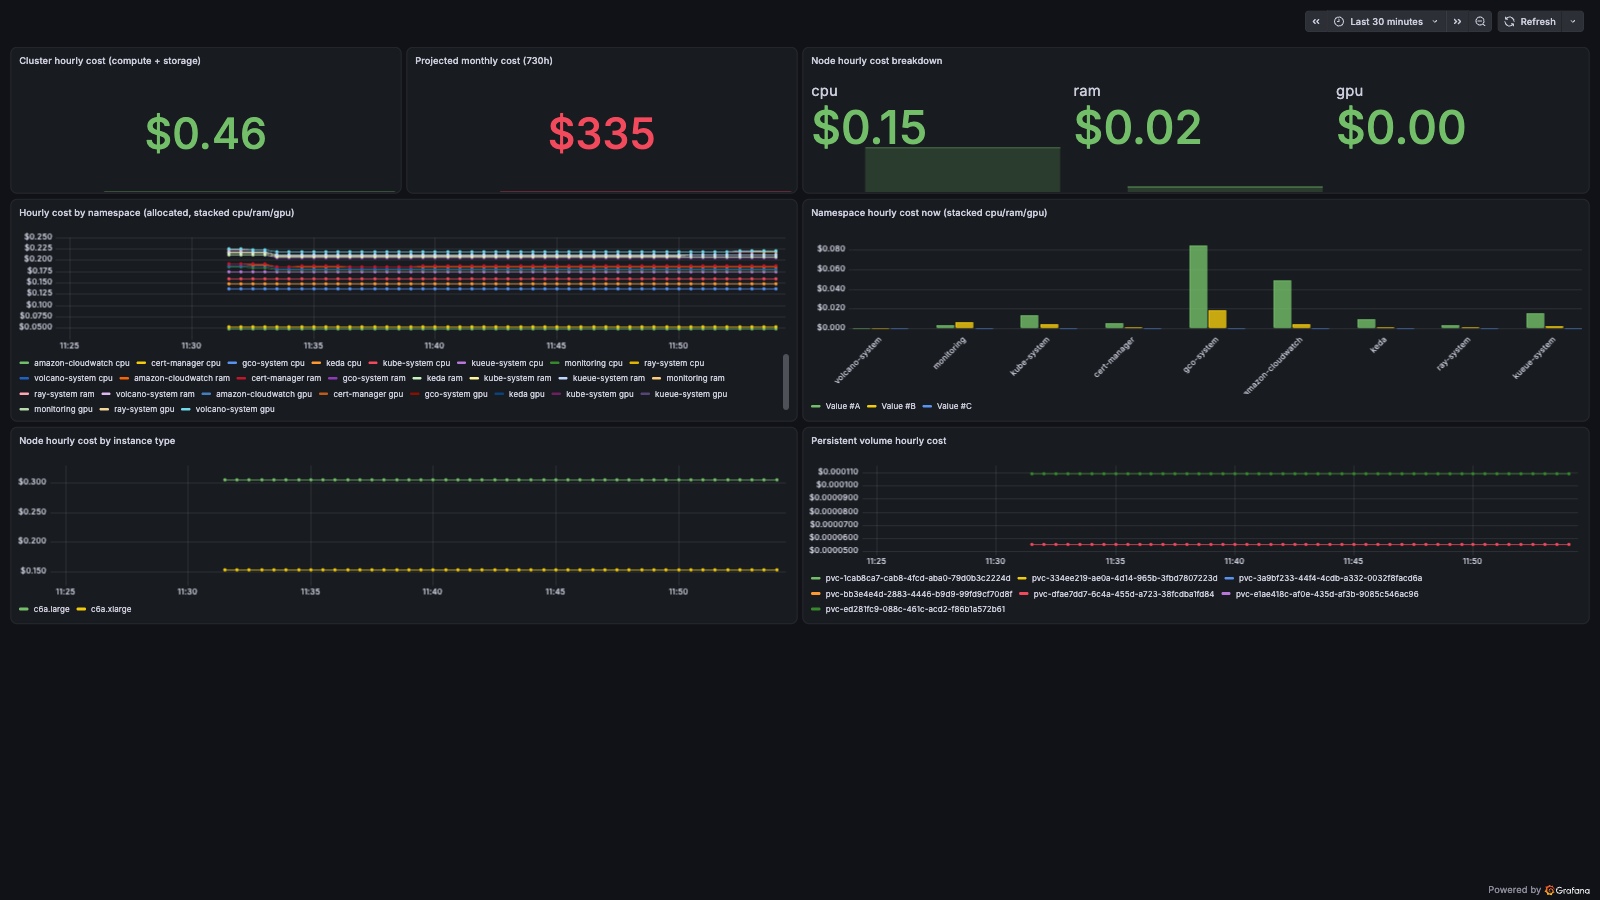
The cost dashboard: cluster and projected monthly cost with node and namespace splits.
MLflow experiment tracking is on by default with observability:
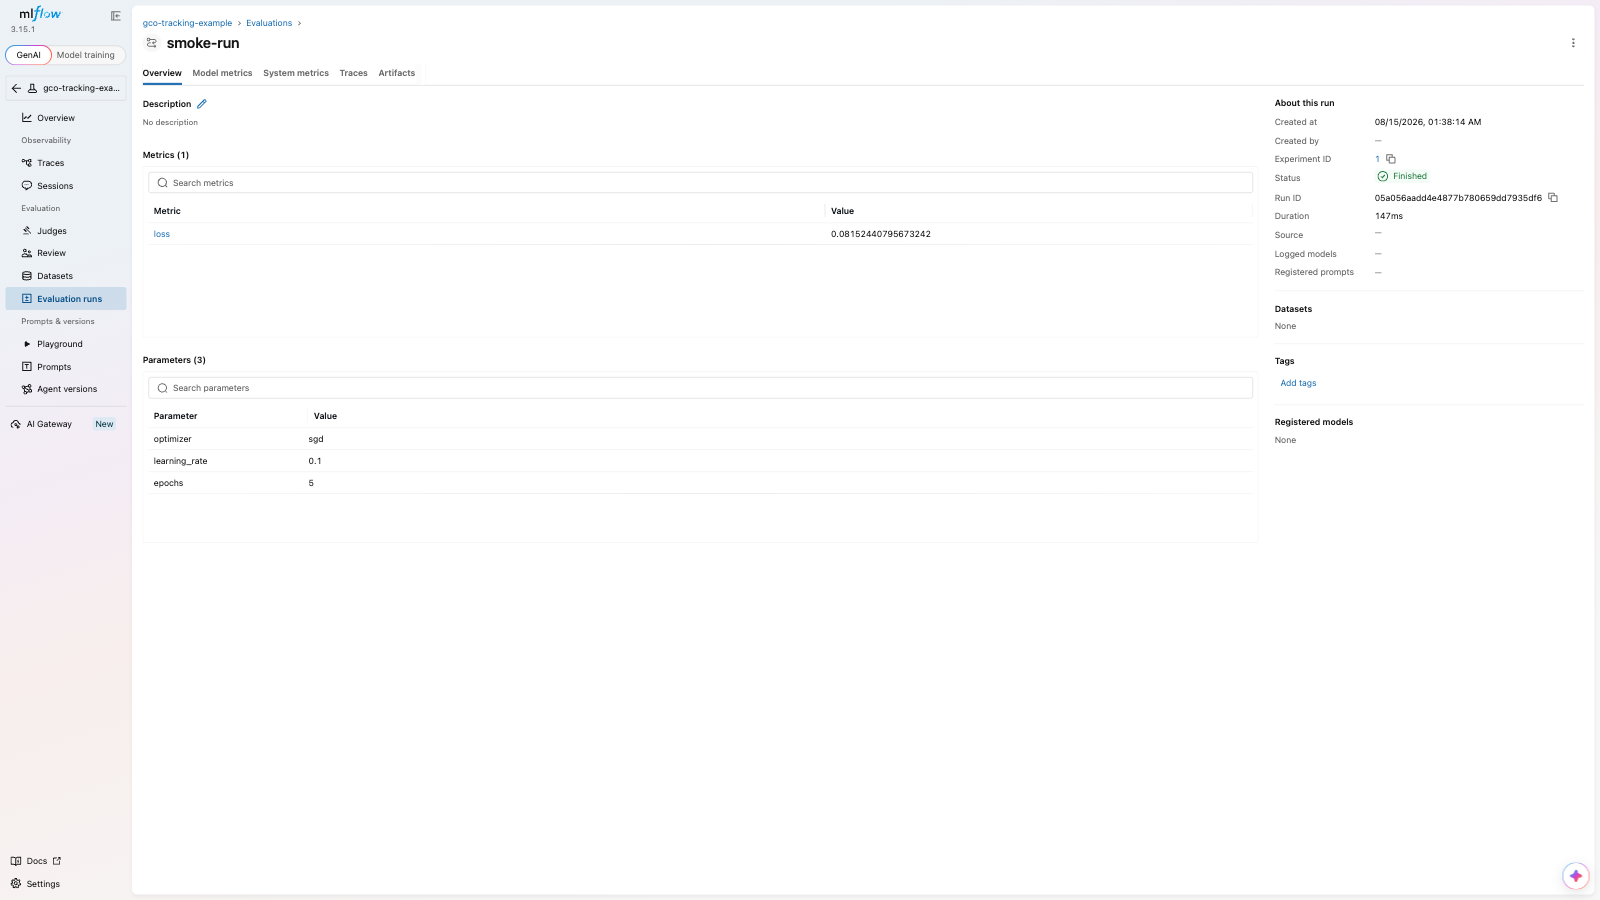
The MLflow tracking server showing a finished run — this exact run is produced by one of the shipped example manifests.
See docs/MONITORING.md and docs/COST_MONITORING.md.
Interactive analytics (optional)
An opt-in analytics environment bolts a SageMaker Studio domain, EMR Serverless, and Cognito-authenticated presigned sessions onto an existing deployment — off by default and zero cost until enabled:
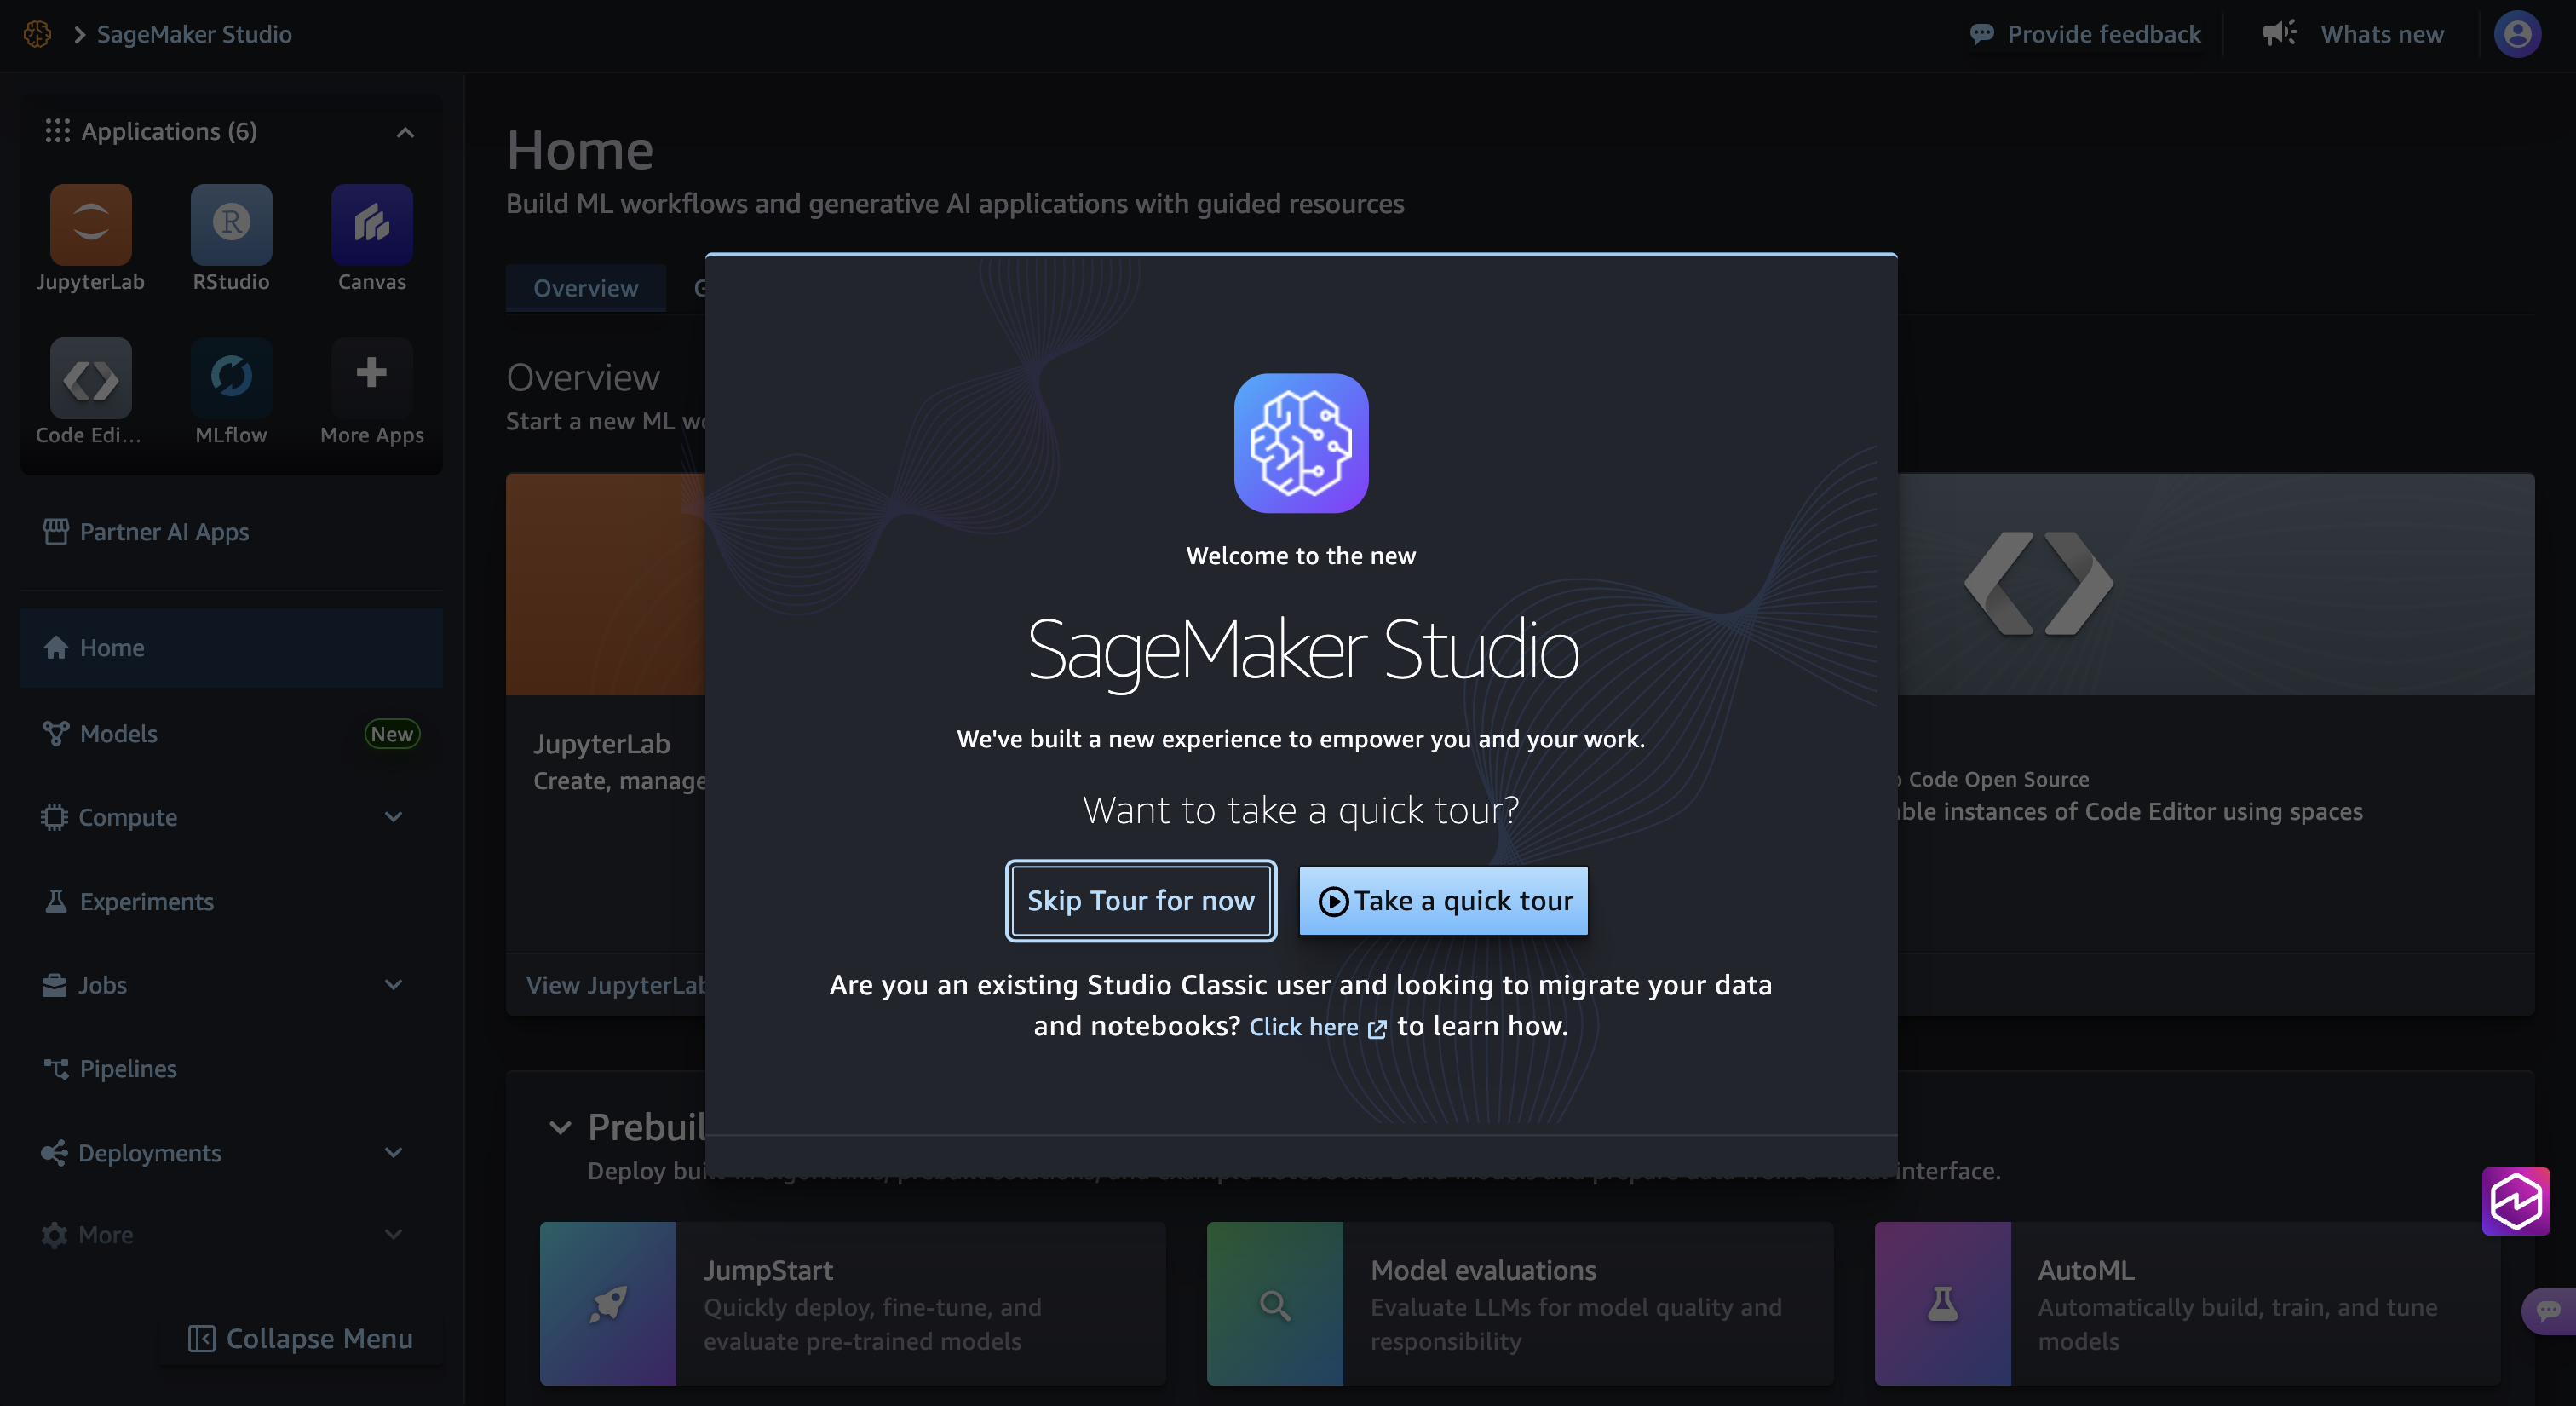
The SageMaker Studio landing screen after logging in through the
gco analytics CLI.
Details, sub-toggles (HyperPod, Canvas, managed MLflow), and cleanup behavior are in docs/ANALYTICS.md.
And a goal-directed loop
Mission is GCO's opt-in iteration loop: five-phase iterations (propose → execute → observe → evaluate → decide) against machine-checkable success criteria until a verdict is reached — see docs/MISSION.md.