Agent Analysis Feature
Copyright Amazon.com, Inc. or its affiliates. All Rights Reserved. SPDX-License-Identifier: MIT-0
Agent Analysis Feature
Section titled “Agent Analysis Feature”The GenAIIDP solution includes an integrated Agent Analysis feature that provides intelligent document analysis capabilities through multiple specialized AI agents. This feature enables you to interactively query and analyze your processed document data using natural language, with an intelligent orchestrator that routes queries to the most appropriate specialized agent.
Overview
Section titled “Overview”The Agent Analysis feature provides intelligent data exploration and analysis capabilities through:
- Multi-Agent Architecture: Multiple specialized agents handle different types of queries
- Intelligent Orchestration: Automatic routing of queries to the most appropriate agent
- Natural Language Querying: Ask questions about your document data in plain English
- Automated SQL Generation: Analytics agents convert questions into optimized SQL queries
- Interactive Visualizations: Generate charts, graphs, and tables from query results
- Real-time Analysis: Get insights from your processed documents without manual data analysis
- Secure Code Execution: Python visualization code runs in isolated AWS Bedrock AgentCore sandboxes
- MCP Integration: Connect external systems and tools via Model Context Protocol (MCP) servers
Key Features
Section titled “Key Features”- Multi-Agent System: Specialized agents for different types of queries (analytics, calculations, etc.)
- Intelligent Orchestration: Automatic query routing based on content analysis and agent capabilities
- Multi-Agent Selection: Select multiple agents simultaneously for complex analysis workflows
- MCP External Integration: Connect custom external tools and systems via MCP servers
- Secure Architecture: All code execution happens in AWS Bedrock AgentCore sandboxes, not in Lambda functions
- Database Schema Discovery: Analytics agents automatically explore and understand your database structure
- Flexible Visualization: Supports multiple chart types including bar charts, line charts, pie charts, and data tables
- Query History: Track and manage previous questions through the web interface with agent selection memory
- Real-time Progress: Live display of agent thought processes and execution steps
- Error Handling: Intelligent retry logic for failed queries with automatic corrections
Architecture
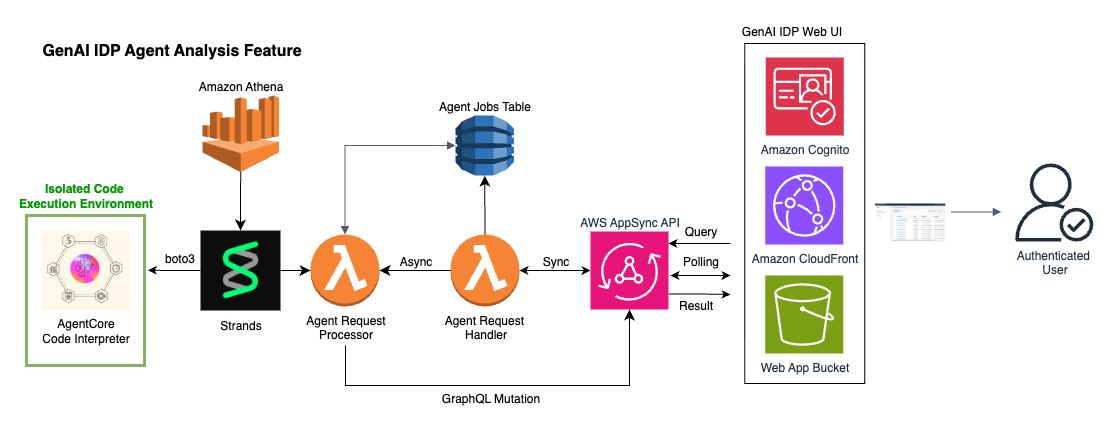
Section titled “Architecture”The architecture of the Agent Analysis feature is shown below. The Web UI and AppSync API components are the same as used by the rest of the IDP system (with new AppSync endpoints added). Note the inclusion of Amazon Athena and the AgentCore Code Interpreter is specific to the Analytics Agent, but the Agent Request Handler and Processor lambdas along with jobs table are used for all agents, including MCP agents.
Multi-Agent System
Section titled “Multi-Agent System”The Agent Analysis feature uses a multi-agent architecture with:
- Orchestrator Agent: Routes queries to appropriate specialized agents based on query content and agent capabilities
- Analytics Agent: Handles data analysis, SQL generation, and visualization creation
- External MCP Agents: Custom agents connected via Model Context Protocol servers
Agent Workflow
Section titled “Agent Workflow”- Question Processing: User submits a natural language question through the web UI
- Agent Selection: User can choose multiple specific agents or let the orchestrator decide automatically
- Query Routing: Orchestrator analyzes the query and routes it to the most appropriate specialized agent
- Specialized Processing: Selected agent processes the query using its specific tools and capabilities
- Result Generation: Agent generates appropriate responses (visualizations, calculations, text, etc.)
- Result Display: Final results are displayed in the web interface with agent conversation history
Analytics Agent Workflow
Section titled “Analytics Agent Workflow”For data analysis queries, the Analytics Agent follows this workflow:
- Database Discovery: Agent explores database schema using
get_database_infotool - SQL Generation: Agent converts the question into optimized SQL queries with proper column quoting
- Query Execution: SQL queries are executed against Amazon Athena with results stored in S3
- Data Processing: Query results are securely transferred to AWS Bedrock AgentCore sandbox
- Visualization Generation: Python code generates charts or tables from the data
- Result Display: Final visualizations are displayed in the web interface
Security Architecture
Section titled “Security Architecture”The Agent Analysis feature implements a security-first design:
- Sandboxed Execution: All Python code runs in AWS Bedrock AgentCore, completely isolated from the rest of the AWS environment and the internet
- Secure Data Transfer: Query results are transferred via S3 and AgentCore APIs, never through direct file system access
- Session Management: Code interpreter sessions are properly managed and cleaned up after use
- Minimal Permissions: Each component requests only the necessary AWS permissions
- Audit Trail: Comprehensive logging and monitoring for security reviews
Data Flow
Section titled “Data Flow”User Question → Analytics Request Handler → Analytics Processor → Agent Tools: ├── Database Info Tool ├── Athena Query Tool ├── Code Sandbox Tool └── Python Execution Tool ↓Results ← Web UI ← AppSync Subscription ← DynamoDB ← Agent ResponseAvailable Tools
Section titled “Available Tools”The analytics agent has access to four specialized tools:
1. Database Information Tool
Section titled “1. Database Information Tool”- Purpose: Discovers database schema and table structures
- Usage: Automatically called to understand available tables and columns
- Output: Table names, column definitions, and data types
2. Athena Query Tool
Section titled “2. Athena Query Tool”- Purpose: Executes SQL queries against the analytics database
- Features:
- Automatic column name quoting for Athena compatibility
- Query result storage in S3
- Error handling and retry logic
- Support for both exploratory and final queries
3. Code Sandbox Tool
Section titled “3. Code Sandbox Tool”- Purpose: Securely transfers query results to AgentCore sandbox
- Security: Isolated environment with no Lambda file system access
- Data Format: CSV files containing query results
4. Python Execution Tool
Section titled “4. Python Execution Tool”- Purpose: Generates visualizations and tables from query data
- Libraries: Pandas, Matplotlib, and other standard Python libraries
- Output: JSON-formatted charts and tables for web display
Using Agent Analysis
Section titled “Using Agent Analysis”Accessing the Feature
Section titled “Accessing the Feature”- Log in to the GenAIIDP Web UI
- Navigate to the “Agent Analysis” section in the main navigation
- You’ll see a chat-like interface for querying your document data
Agent Selection
Section titled “Agent Selection”The Agent Analysis interface allows you to select from multiple available agents:
Multi-Agent Selection:
- Select multiple agents simultaneously for complex analysis workflows
- Use “Select All Agents” / “Deselect All Agents” for bulk selection
- Each agent brings specialized capabilities to your analysis
Available Agent Types:
- Analytics Agent: Database queries, SQL generation, and data visualization
- Dummy Agent: Simple calculations and testing capabilities
- External MCP Agents: Custom tools and systems integrated via MCP servers
Agent Selection Tips:
- Select specific agents when you know what type of analysis you need
- Choose multiple agents for comprehensive analysis requiring different capabilities
- The system intelligently routes your question to the most appropriate selected agents
MCP Integration
Section titled “MCP Integration”Custom System Integration:
- Click ”🚀 NEW: Integrate your own systems with MCP!” to learn about connecting external tools
- Add custom agents without code changes or redeployments
- Integrate APIs, databases, and specialized tools via Model Context Protocol servers
For detailed MCP setup instructions, see the Custom MCP Agent Documentation.
Asking Questions
Section titled “Asking Questions”The agent can answer various types of questions about your processed documents:
Document Volume Questions:
- “How many documents were processed last month?”
- “What’s the trend in document processing over time?”
- “Which document types are most common?”
Processing Performance Questions:
- “What’s the average processing time by document type?”
- “Which documents failed processing and why?”
- “Show me processing success rates by day”
Content Analysis Questions:
- “What are the most common vendor names in invoices?”
- “Show me the distribution of invoice amounts”
- “Which documents have the highest confidence scores?”
Comparative Analysis Questions:
- “How do confidence scores vary by document type?”
- “What’s the relationship between document size and processing time?”
Sample Queries
Section titled “Sample Queries”Here are some example questions you can ask:
"Show me a chart of document processing volume by day for the last 30 days"
"What are the top 10 most common document classifications?"
"Create a table showing average confidence scores by document type"
"Plot the relationship between document page count and processing time"
"Which extraction fields have the lowest average confidence scores?"
Understanding Results
Section titled “Understanding Results”The agent can return three types of results:
- Charts/Plots: Visual representations of data trends and patterns
- Tables: Structured data displays for detailed information
- Text Responses: Direct answers to simple questions
Each result includes:
- The original question
- SQL queries that were executed
- The final visualization or answer
- Agent reasoning and thought process
Testing with Sample Data
Section titled “Testing with Sample Data”The solution includes sample W2 tax documents for testing the analytics feature:
Sample Documents Location
Section titled “Sample Documents Location”- Path:
/samples/w2/ - Files: 20 sample W2 documents (W2_XL_input_clean_1000.pdf through W2_XL_input_clean_1019.pdf)
- Purpose: Realistic test data for exploring analytics capabilities
- Source: Sample W2 documents are from this kaggle dataset and are 100% synthetic with a CC0 1.0 public domain license.
Testing Steps
Section titled “Testing Steps”-
Upload Sample Documents:
- Use the Web UI to upload documents from the
/samples/w2/folder - Or copy them directly to the S3 input bucket
- Use the Web UI to upload documents from the
-
Wait for Processing:
- Monitor document processing through the Web UI dashboard
- Ensure all documents complete successfully
-
Try Sample Queries:
"How many W2 documents have been processed?""Make a bar chart histogram of total earnings in all W2s with bins $25000 wide""What employee from the state of California paid the most tax?""What is the ratio of state tax paid to federal tax paid for the following states: Vermont, Nevada, Indiana, and Oregon?"
Configuration
Section titled “Configuration”The Agent Analysis feature is configured through CloudFormation parameters:
Model Selection
Section titled “Model Selection”ChatCompanionModelId: Type: String Default: "us.anthropic.claude-3-7-sonnet-20250219-v1:0" Description: Model to use for Document Analysis Agent (analytics queries)Supported Models:
us.anthropic.claude-3-7-sonnet-20250219-v1:0(Default - Recommended)us.anthropic.claude-3-5-sonnet-20241022-v2:0us.anthropic.claude-3-haiku-20240307-v1:0us.amazon.nova-pro-v1:0us.amazon.nova-lite-v1:0
Infrastructure Components
Section titled “Infrastructure Components”The feature automatically creates:
- DynamoDB Table: Tracks analytics job status and results
- Lambda Functions: Request handler and processor functions
- AppSync Resolvers: GraphQL API endpoints for web UI integration
- IAM Roles: Minimal permissions for secure operation
Environment Variables
Section titled “Environment Variables”Key configuration settings:
ANALYTICS_TABLE: DynamoDB table for job trackingATHENA_DATABASE: Database containing processed document dataATHENA_OUTPUT_LOCATION: S3 location for query resultsCHAT_COMPANION_MODEL_ID: AI model for agent processing
Best Practices
Section titled “Best Practices”Query Optimization
Section titled “Query Optimization”- Start Broad: Begin with general questions before diving into specifics
- Be Specific: Clearly state what information you’re looking for
- Use Follow-ups: Build on what you learned in previous questions to explore topics in depth (note: each question is independent; there is no actual conversation history)
- Check Results: Verify visualizations make sense for your data
Security Best Practices
Section titled “Security Best Practices”- Data Access: Only authenticated users can access analytics features
- Query Isolation: Each user’s queries are isolated and tracked separately
- Audit Logging: All queries and results are logged for security reviews
- Sandbox Security: Python code execution is completely isolated from system resources
Troubleshooting
Section titled “Troubleshooting”Common Issues
Section titled “Common Issues”Agent Not Responding:
- Check CloudWatch logs for the Analytics Processor Lambda function
- Verify Bedrock model access is enabled for your selected model
- Ensure sufficient Lambda timeout (15 minutes) for complex queries
SQL Query Errors:
- Agent automatically retries failed queries up to 5 times
- Check that column names are properly quoted in generated SQL
- Verify database permissions for Athena access
Visualization Errors:
- Check that query results contain expected data types
- Verify Python code generation in AgentCore sandbox
- Review agent messages for detailed error information
Performance Issues:
- Consider using simpler queries for large datasets
- Try breaking complex questions into smaller parts
- Monitor Athena query performance and optimize if needed
Monitoring and Logging
Section titled “Monitoring and Logging”- CloudWatch Logs: Detailed logs for both Lambda functions
- DynamoDB Console: View job status and results directly
- Athena Console: Monitor SQL query execution and performance
- Agent Messages: Real-time display of agent reasoning in web UI
Cost Considerations
Section titled “Cost Considerations”The Agent Analysis feature uses several AWS services that incur costs:
- Amazon Bedrock: Model inference costs for agent processing
- AWS Bedrock AgentCore: Code interpreter session costs
- Amazon Athena: Query execution costs based on data scanned
- Amazon S3: Storage costs for query results
- AWS Lambda: Function execution costs
- Amazon DynamoDB: Storage and request costs for job tracking
To optimize costs:
- Choose appropriate Bedrock models based on accuracy vs. cost requirements
- Monitor usage through AWS Cost Explorer
Integration with Other Features
Section titled “Integration with Other Features”The Agent Analysis feature has access to all tables that the GenAIIDP stores in Athena. Therefore it integrates seamlessly with other GenAIIDP capabilities:
Evaluation Framework Integration
Section titled “Evaluation Framework Integration”- Query evaluation metrics and accuracy scores
- Analyze patterns in document processing quality
- Compare performance across different processing patterns
Assessment Feature Integration
Section titled “Assessment Feature Integration”- Explore confidence scores across document types
- Identify low-confidence extractions requiring review
- Analyze relationships between confidence and accuracy
Future Enhancements
Section titled “Future Enhancements”Planned improvements for the Agent Analysis feature include:
- Dashboard Creation: Save and share custom analytics dashboards
- Possible KB Unification: Have one chat box in the UI which is capable of answering questions based either on the knowledge base (with semantic abilities), or on the Athena tables.