Guidance for Network Monitoring and Alerting Automation on AWS
Summary: This implementation guide provides an overview of the Guidance for Network Monitoring and Alerting Automation on AWS, its reference architecture and components, considerations for planning the deployment, and configuration steps for deploying the Guidance name to Amazon Web Services (AWS). This guide is intended for solution architects, business decision makers, DevOps engineers, data scientists, and cloud professionals who want to implement Guidance for Network Monitoring and Alerting Automation on AWS in their environment.
Overview
The project is an example of how to use AWS Resource Groups Tagging API to retrieve a specific tag and then based on found resources pull additional information from respective service APIs to generate a configuration file (JSON) to build a CloudWatch Dashboard with _reasonable_ metrics and alarms. Optionally users can also deploy a central alarm dashboard to monitor alarms across their AWS Organization, AWS Organization OU or arbitrary number of AWS accounts.
Supported services for monitoring
This guidance focuses on automation of Network services monitoring even though other AWS services listed above are supported by code as well.
Central Alarm Dashboard features
- Event-driven for scalability and speed
- Supports arbitrary source accounts within an AWS Organization (different teams can have own dashboards)
- Supports automatic source account configuration through stack-sets
- Supports visualization and sorting of alarm priority (CRITICAL, MEDIUM, LOW) through alarm tags in source accounts. (Simply add tag with key
priorityand values critical, medium or low). - Supports tag data for EC2 instances in source accounts
Architecture Overview
At its core, the guidance generates and deploys CloudWatch Dashboards for monitoring of existing resources, using CDK and Resource Groups And Tagging API. Optionally customers can also select to install a cross account cross region Alarm Dashboard in a monitoring account.
The Metric Dashboards feature does not have any “active” architecture but rather deploys static definition of one or a set of CloudWatch Dashboards.
The Alarm Dashboard feature is a serverless application and has several components that enable Alarm forwarding, enrichment and visualization.
Key elements of the Alarm Dashboard architecture include:
- Amazon CloudWatch Alarms: A set of alarms that customer wants to observe on a single Dashboard.
- Amazon Eventbridge: Responsible for forwarding Alarm State Change-events to the central account.
- AWS Lambda: Lambda functions are used to handle events, fetch additional information, store and visualize the alarm status on a single Dashboard.
- Amazon DynamoDB: A DynamoDB table is used to store the Alarm event information.
This architecture is designed to provide a secure, scalable, and easily manageable serverless environment, incorporating AWS best practices and ready for production workloads.
Architecture diagrams and steps
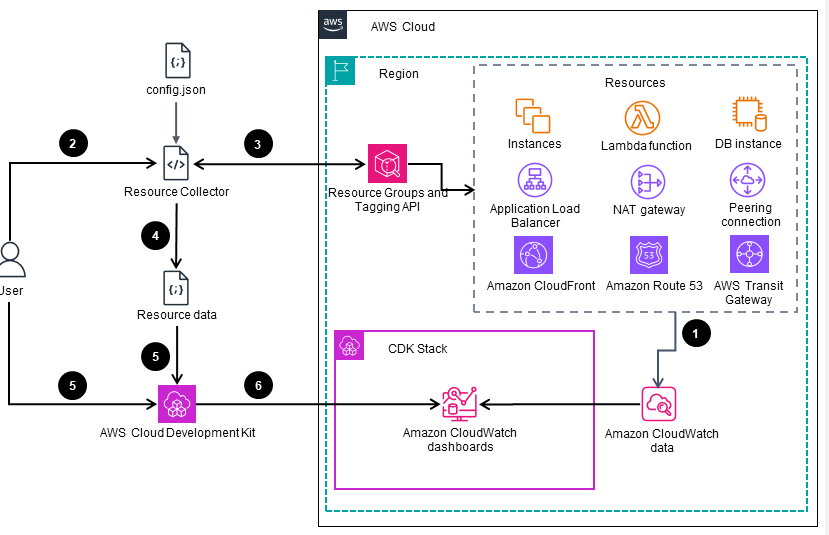
Figure 1: High level Deployment automation process for the Guidance
- A group of AWS Cloud resources continuously store related metrics in the Amazon CloudWatch data store.
- The user initiates the
Guidance Resource Collectorscript that uses the config file. - The Guidance Resource Collector fetches resources matching the config file from the AWS Resource Groups Tagging API Reference.
- The Guidance Resource Collector saves resource data in a JSON file.
- The user initiates the AWS Cloud Development Kit (AWS CDK) to synthesize an AWS CloudFormation template. The CloudFormation template is using AWS monitoring best practices.
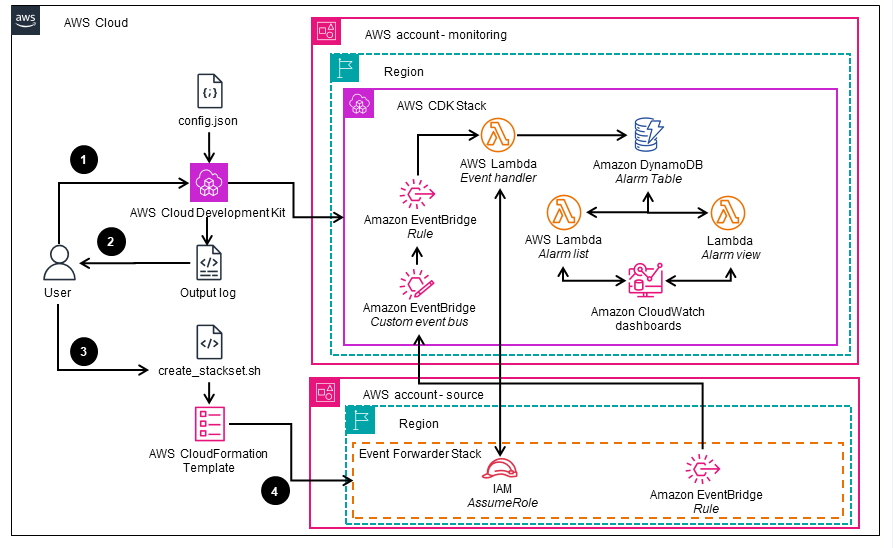
Figure 2: Deployment automation to generate and deploy the “Event Forwarder Stack” required for configuring the AWS accounts where the resources being monitored reside
- The user runs the
cdk deploycommand to generate the CloudFormation template and deploy the infrastructure within the designated “monitoring” account. - The user records the output of the deployment, which contains the Amazon Resource Names (ARNs) of the central custom Amazon EventBridge event bus and the AWS Lambda function execution role.
- The user provides the ARNs obtained from the previous step to generate the CloudFormation template for the
Event Forwarder Stackwhich is required for configuring the source accounts. - The user deploys the CloudFormation template for the
Event Forwarder Stackto the intended source accounts, either individually or across multiple accounts and Regions, using CloudFormation StackSets.
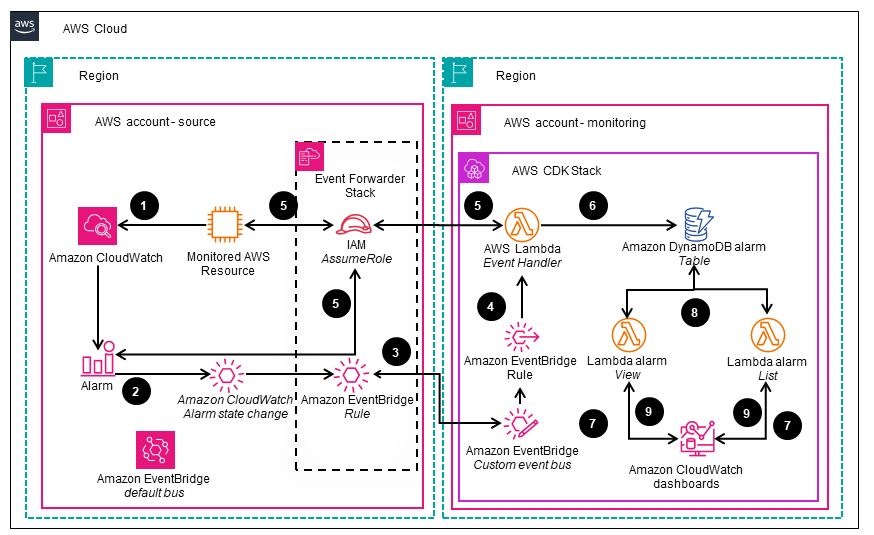
Figure 3: Flow of events when a CloudWatch alarm is triggered and processed by AWS Lambda functions
- An AWS Cloud resource sends a metric that breaches a threshold defined in a CloudWatch alarm.
- When the alarm is triggered, CloudWatch emits a “CloudWatch Alarm State Change” event on the EventBridge default bus within the respective account.
- An EventBridge Rule on the default bus forwards the event to the central custom EventBridge event bus.
- An EventBridge Rule defined within the central event bus dispatches the event to the ”Event Handler” Lambda function that analyzes the event
- The ”Event Handler” Lambda function assumes an AWS Identity and Access Management(IAM) role that has been deployed by the “Event Forwarder” CloudFormation stack set in the source account. It then queries the monitored resource and the CloudWatch alarm for additional details
- The “Event Handler” Lambda function consolidates the additional details with the event and stores the combined information in an Amazon DynamoDB alarms table.
- The CloudWatch dashboard, which includes custom CloudWatch widgets, triggers the execution of two Lambda functions—”View” and “List” — upon each dashboard would refresh.
- The “View” and “List” Lambda functions retrieve and filter the alarm data, then generate HTML code for rendering within the respective CloudWatch custom widgets.
- The “View” and “List” Lambda functions return the HTML code to the CloudWatch widgets, which then render it, including the relevant metrics, on the CloudWatch user interface.
AWS Services used in this Guidance
| AWS service | Role | |
|---|---|---|
| AWS CloudFormation | Supporting | Deployment of CDK generated core components. |
| Amazon CloudWatch | Core | Collects Metrics, Dashboards, Alarms. |
| Amazon Eventbridge | Core | An EventBridge default event bus is paired with EventBridge rules to route CloudWatch Alarm events to a central custom event bus. The received events are then processed and stored in a DynamoDB database. |
| AWS Lambda | Core | Runs custom code in response to events. This guidance contains Lambda functions to 1. Collect alarm events, look up additional information about the resource that triggered the alarm and then store the data in DynamoDB database 2. Render the two CloudWatch custom widgets on the Alarm Dashboard. |
| Amazon DynamoDB | Core | Acts as a storage for alarm objects. Alarm objects (event and the additional information about the resource) are written to a DynamoDB table. Two CloudWatch custom widgets invoke respective Lambda functions that retrieve filtered Alarm objects from the table and render the Alarms on the Dashboard each time the Dashboard refreshes. |
Plan your deployment
Cost
This contains of two distinct features - Metric Dashboards and Alarm Dashboard.
Metric Dashboards
The cost is mostly generated by the number of CloudWatch Dashboards in the account, where first three Dashboards are free, and the number of Alarms. The guidance code will try to respect the best design practices, convenience of use and hard limits of CloudWatch (no more than 500 widgets per Dashboard) and create additional Dashboards to place the widgets on. Some configuration parameters may cause more Dahsboards to be created, like GroupingTagKey or Compact-mode.
You can learn the estimated cost of the metric Dashboard deployment by running cdk synth. The code will construct the CloudFormation template and estimate the cost based on number of Dashboards and Alarms generated without deploying it. Instead you will see the estimated cost on the screen.
These are the only cost drivers. Number of metrics or existing resources tagged do not affect the cost directly.
Alarm Dashboard
The Alarm Dashboard is deployed as serverless and event driven architecture with on-demand cost model. There are two main drivers of cost:
Alarms changing state - As an alarm changes state, an event is emitted and workflow is triggered. The workflow will forward the event to a central monitoring account and execute a Lambda function that will look up more information about the resource monitored for additional context and lookup more information about the Alarm itself. Such as Alarm tags. This to be able to visualize “priority” of an Alarm. Then it will store that object into DynamoDB table. Cost drivers here are number of existing alarms and frequency at which they change state.
Alarm Dashboard refreshing - Depending on “refresh” setting of the Alarm Dashboard, the Dashboard will invoke the two Lambda functions that are part of the two CloudWatch custom widgets. The Lambda functions will fetch objects from the DynamoDB table and render HTML to display Alarms in alarm state and a list of Alarms. Cost drivers here are the refresh setting which drives the number of Lambda function invocations, object size and which drives the amount of DynamoDB Read Request Units. For the calculation below, the most pessimistic (expensive) settings were used for refresh (10s).
You are responsible for the cost of the AWS services used while running this guidance. As of April 2024, the cost for running this guidance with the default settings in the US East (N. Virginia) Region is approximately $1 per month, assuming 3,000 transactions.
This guidance uses Serverless services, which use a pay-for-value billing model. Costs are incurred with usage of the deployed resources. Refer to the Sample cost table for a service-by-service cost breakdown.
We recommend creating a budget through AWS Cost Explorer to help manage costs. Prices are subject to change. For full details, refer to the pricing webpage for each AWS service used in this guidance.
Sample Cost Table
The following table provides a sample cost breakdown for deploying this guidance with the default parameters in the us-east-1 (US East - N. Virginia) Region for one month assuming “non-production” level metrics volume.
| AWS service | Dimensions | Cost [USD] |
|---|---|---|
| Amazon CloudWatch | 1 Charged dashboard | $ 3.00 |
| Amazon DynamoDB | 1Gb data storage, Standard table class on-demand capacity, 1 million writes/month, 2 million reads/month | $ 3.00 |
| AWS Lambda | 618 400 requests per month with 3000 ms avg duration, 256 MB memory, 512 MB ephemeral storage | $ 7.85 |
| Amazon EventBridge | 1 million custom events per month and 1 million cross region events | $ 2.00 |
| Total estimated cost per month: | $15.85 |
A sample cost breakdown for production scale load (10 000 Alarms, each triggering 10 times a month) can be found in this AWS Pricing Calculator estimate and is estimated around $15.85 USD/month
Security
When you build systems on AWS infrastructure, security responsibilities are shared between you and AWS. This shared responsibility model reduces your operational burden because AWS operates, manages, and controls the components. These components include the host operating system, the virtualization layer, and the physical security of the facilities in which the services operate. For more information about AWS security, visit AWS Cloud Security.
Supported AWS Regions
This Guidance is supported in all currently available AWS Regions.
Quotas
Service quotas, also referred to as limits, are the maximum number of service resources or operations for your AWS account.
Quotas for AWS services in this Guidance
Make sure you have sufficient quotas for each of the services implemented in this guidance. For more information, see AWS service quotas.
To view the service quotas for all AWS services in the documentation without switching pages, view the information in the Service endpoints and quotas page in the PDF instead.
Deploy the Guidance
Prerequisites
Prerequisites to generate the resource configuration:
- Python 3
- Boto 3 (Python module.
python3 -m pip install boto3)
To generate and deploy the dashboard
- NodeJS 16+, recommended 18LTS, (required by CDK v2)
- CDK v2 (Installation command:
npm -g install aws-cdk@latest) - Credentials to authenticate to an AWS account.
Deployment process overview
Before you launch the Guidance, review the cost, architecture, security, and other considerations discussed in this guide. Follow the step-by-step instructions in this section to configure and deploy the Guidance into your account.
Time to deploy: Approximately ~15 minutes
Configuration properties in lib/config.json
BaseName (String:required) - Base-name of your dashboards. This will be the prefix of the dashboard names.
ResourceFile (String:required) - The path for the file where resources are stored. Used by the resource_collector.py when generating resource config and by the CDK when generating the CF template.
TagKey (String:required) - Configuration of the tag key that will select resources to be included.
TagValues (Array
Regions (Array
GroupingTagKey (String:optional) - If set, separate Lambda and EC2 dashboards will be created for every value of that tag. Every value groups resources by that value.
CustomEC2TagKeys (Array
CustomNamepsaceFile (String:required) - Detected custom namespaces. Not yet used.
Compact (boolean (true/false):required) - When set to true, multiple Lambda functions will be put in a single widget set. Useful when there are many Lambda functions.
CompactMaxResourcesPerWidget (Integer:required) - When Compact is set to true, determines how many Lambda functions will be in each widget set.
AlarmTopic (String:optional) - When AlarmTopic contains a string with an ARN to a SNS topic, all alarms will be created with an action to send notification to that SNS topic.
AlarmDashboard.enabled (boolean (true/false):optional) - When set to true deploys the alarm dashboard in the account.
AlarmDashboard.organizationId (String: required when AlarmDashboard.enabled is true) - Required in order to set resource policy on the custom event bus to allow PutEvents from the AWS Organization.
MetricDashboards.enabled (boolean (true/false):optional) - If not defined or set to true, deploy metric dashboards. Recommended if only alarm dashboard is being deployed.
Getting and preparing the code
- Check out the project:
git clone https://github.com/aws-solutions-library-samples/guidance-for-network-monitoring-and-alerting-automation-on-aws.git - Change current directory to project directory:
cd guidance-for-network-monitoring-and-alerting-automation-on-aws - If deploying for the first time, run the following command to bootstrap the environment:
cdk bootstrap
If you are sharing the account with others, you can also check if the account is already bootstrapped by checking existence of CDKToolkit-CloudFormation stack. Even easier method is to simply to try to deploy (cdk deploy) without bootstrapping. If the account is not bootstrapped you will get an error. If it is, you will then know not to delete the bootstrap resources should you follow steps under Uninstall the Guidance.
See also (https://docs.aws.amazon.com/cdk/v2/guide/bootstrapping.html){:target=”_blank”}. In case you don’t want to bootstrap, please read Deploying without boostraping CDK.
- Run the following command to install dependencies:
npm install
Configuring the dashboards
- Open the configuration file
lib/config.jsonin your editor of choice. - Set
TagKeyto tag key you want to use andTagValuesto an array of values. Dashboard will collect all resources tagged with that key and the specified values. - Set Regions to include the regions that contain resources you want to monitor.
- OPTIONAL if you want to deploy central alarm dashboard, set
AlarmDashboard.enabledto true and provide your AWS Organizations id inAlarmDashboard.organizationId. - OPTIONAL if you don’t want to use metric dashboards you can disable creation of those by setting
MetricDashboards.enabledto false. See Configuration properties in lib/config.json above for more information. - Save the configuration file.
Below is an example of that configuration file after modification for us-east-2
{
  "BaseName": "Application-dz",
  "ResourceFile": "../data/resources.json",
  "TagKey": "iem",
  "TagValues": ["202102","202202","202302","202402","202502"],
  "Regions": ["us-west-2"],
  "GroupingTagKey": "groupby",
  "CustomEC2TagKeys": ["Add","Your","TagKeys", "Here"],
  "CustomNamespaceFile": "../data/custom_namespaces.json",
  "Compact": false,
  "CompactMaxResourcesPerWidget": 10,
  "AlarmTopic": "",
  "AlarmDashboard": {
    "enabled": true,
    "organizationId": "",
    "alarmViewListSize": 100
  },
  "MetricDashboards": {
    "enabled": true
  }
}
Deploying the dashboards
- If the deployment of the metric dashboards have been enabled, run te following command to create the resource configuration file (
resources.jsonin thedatadirectory):cd data python3 resource_collector.py - OPTIONAL: Edit
BaseName-property inlib/config.jsonto change the name of your dashboard. In case you plan to deploy multiple sets of dashboards for different applications in the same account, ensure all subsequent deploys have differentBaseName. - Run the following command to change directory to project root:
cd .. - Run the following command to generate CF template:
cdk synthor use the following command to deploy directly to your AWS account:
cdk deploy --all - In case central alarm dashboard is enabled in the configuration, take note of deployment output,
*.CustomEventBusArnand*.CustomDynamoDBFunctionRoleArnand copy those ARNs to use in the next stage.
Enabling source accounts to share alarms
This only applies in case AlarmDashboard.enabled parameter is set
- Run the following command to change to directory which contains
event_forwarder_template.yaml:cd stack_sets - Run the following command:
sh create_stackset.sh ARN_OF_CUSTOM_EVENT_BUS ARN_OF_THE_LAMBDA_FUNCTION_ROLE_ARN
and replace the placeholder with the ARNs from the previous step. 3. Deploy the generated event_forwarder.yaml-template manually to each of the source accounts and each region you wish to enable through CloudFormation or deploy it automatically to an AWS Organization, OU or list of accounts through service managed stack-sets from your management account or stack-set delegate account. TO DO : ADD SAMPLE COMMANDS TO DEPLOY THROUGH CF or AWS OU
Monitoring alarms in “Management Account”
In case you have alarms in the AWS Organizations management account but are deploying the Alarm Dashboard in another account, you will need to manually deploy event_forwarder.yaml in the management account in all regions that you want to receive alarms from. This is because of that even if the event_forwarder.yaml is deployed as a managed stack set it won’t get deployed in the management account.
Tips
Try setting up a CodeCommit repository where you store your code. Set up a CI/CD pipeline to automatically redeploy your dashboard. This way, if you want to change/add/remove any metrics for any of the services you change the code, commit it, and it will be automatically deployed.
Try creating an EventBridge rule that will listen to specific tag change and trigger the CodeBuild project to redeploy the dashboard. This way, if you have an autoscaling group or just tag additional resources the dashboard will deploy automatically. In case you do so, monitor your builds to avoid rare situations where a lot of tag changes could cause excessive amounts of concurrent or queued builds (for example event bridge rule misconfiguration or variable loads that causes ASG to scale up and down quickly). This can be done by specifying tag value in the Event Bridge rule or instead of triggering the build directly from Event Bridge sending it to a Lambda function for more flexible decision-making on whether to trigger a build or not.
Screenshots
Click on the thumbnails to see the full res screenshot
Note that all blue labels in the headers (text widgets) are links that will take you to the respective resource in the console for quick access.
Lambda in “compact” mode
Number of Lambda functions per widget is controlled through
CompactMaxResourcesPerWidgetparameter inlib/config.json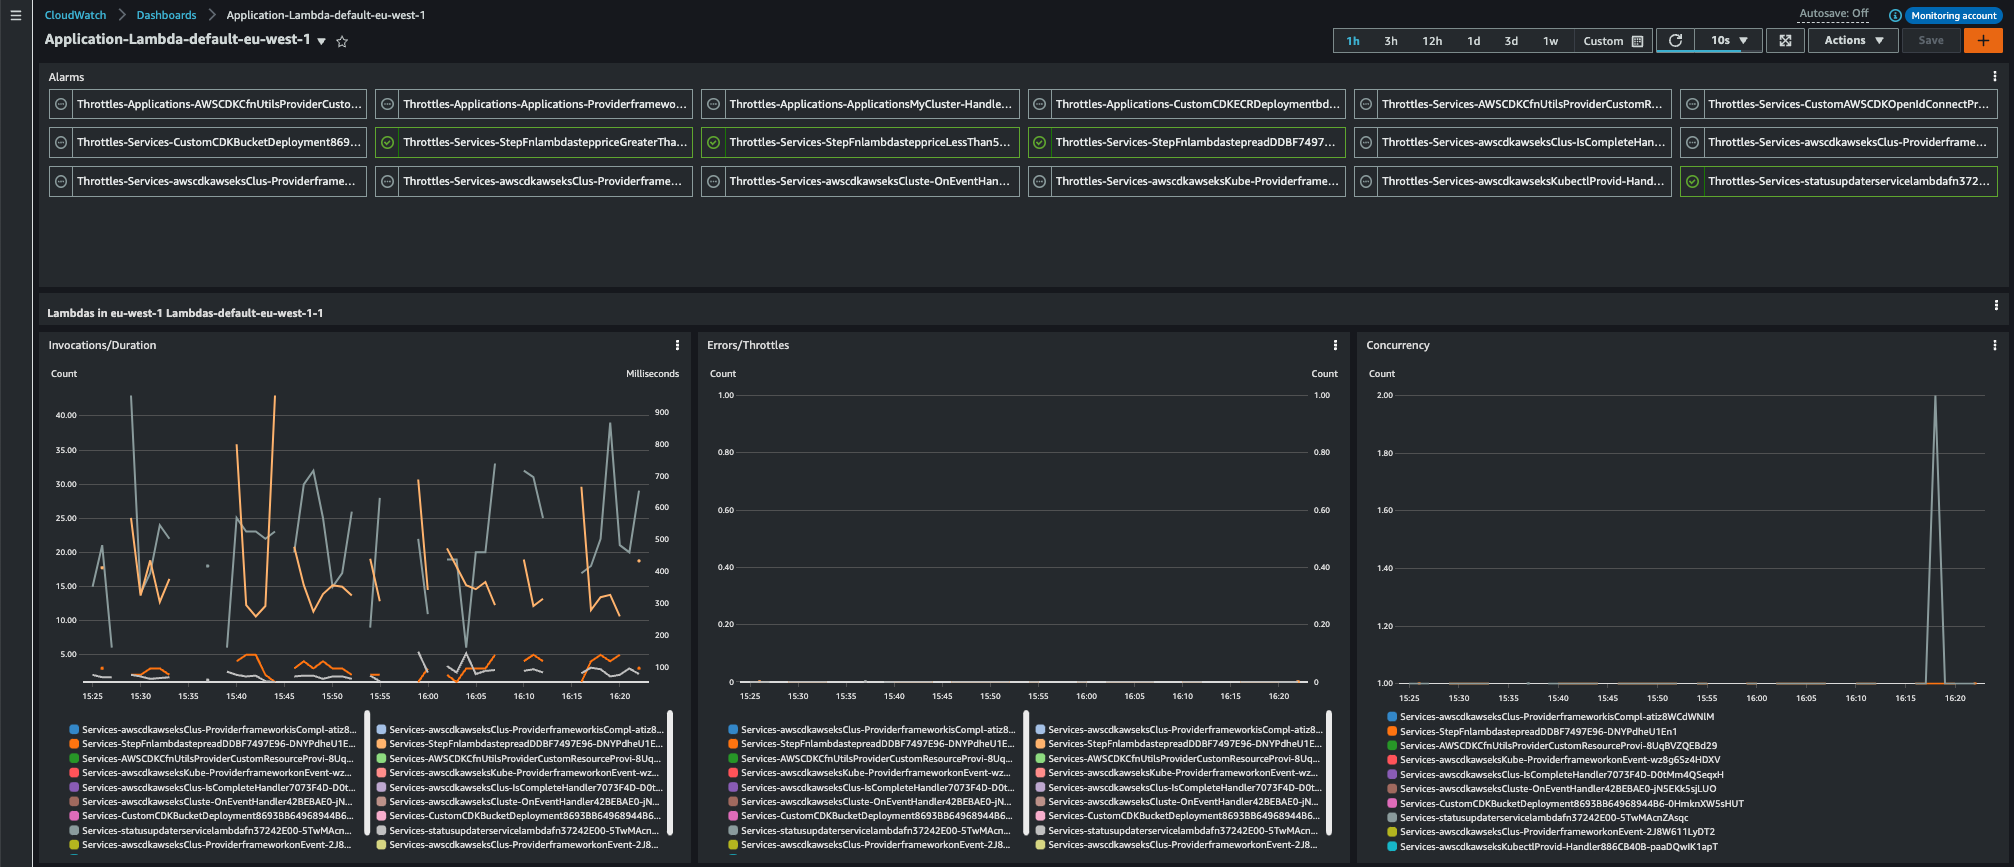
Figure 4. Number of Lambda functions per widget settings
EC2 Instance
- Individual EBS volumes are presented with additional volume information (type and IOPS)
PIO volumes are presented with additional metrics
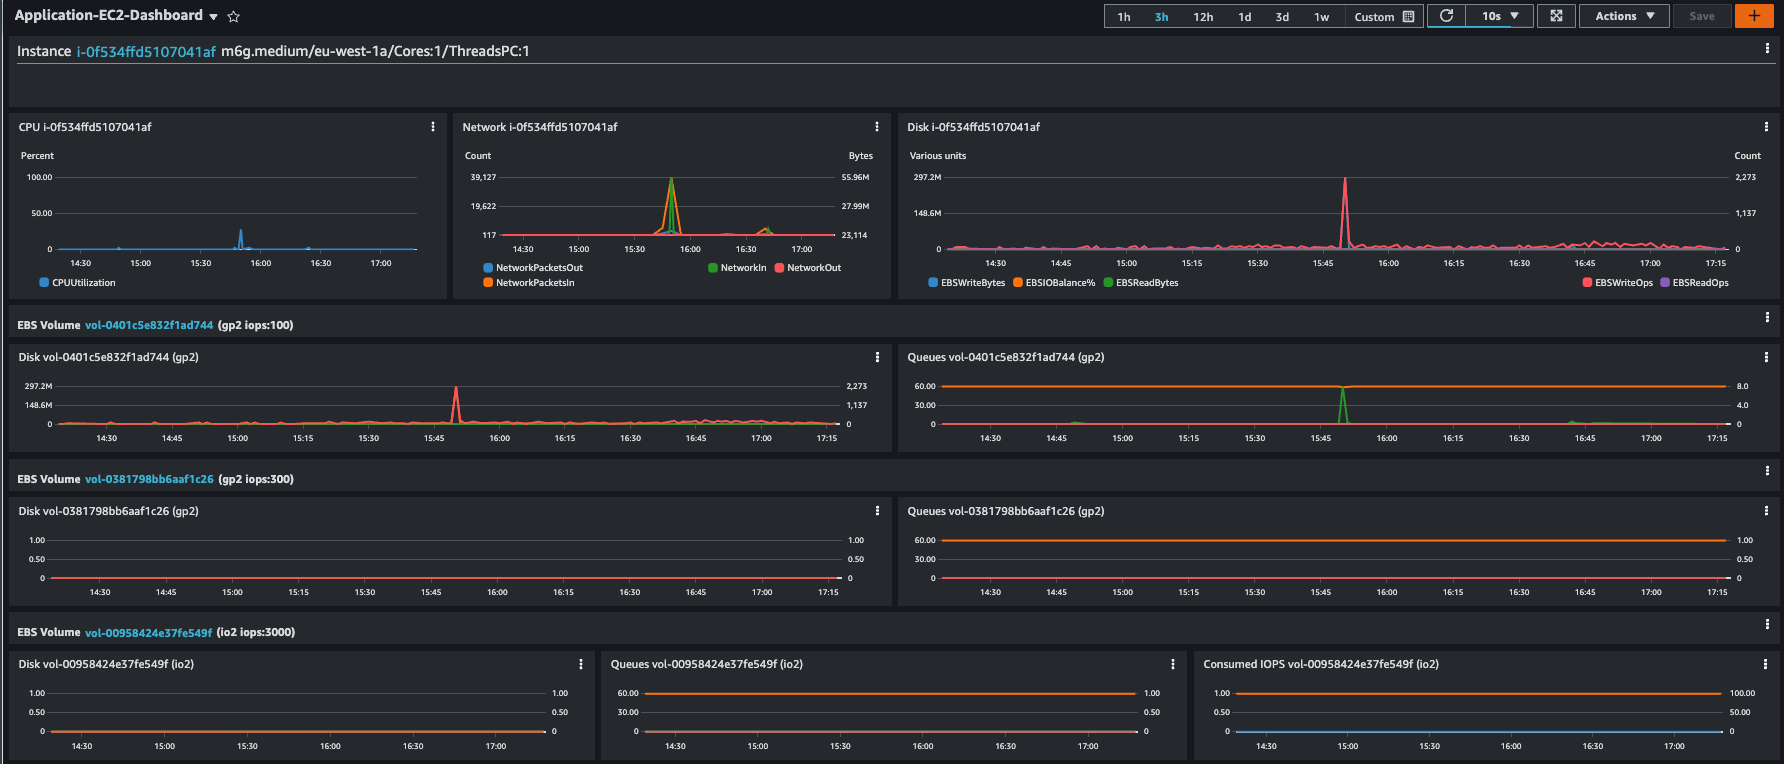
Figure 5. Individual EC2 instances with EBS volumes
Burstable EC2 Instance with CloudWatch agent configured
- Burstable instances are presented with additional burstmode information
- Additional metrics to keep track of CPU-credits usage are shown
- If CloudWatch agent is configured then the widgets are shown automatically
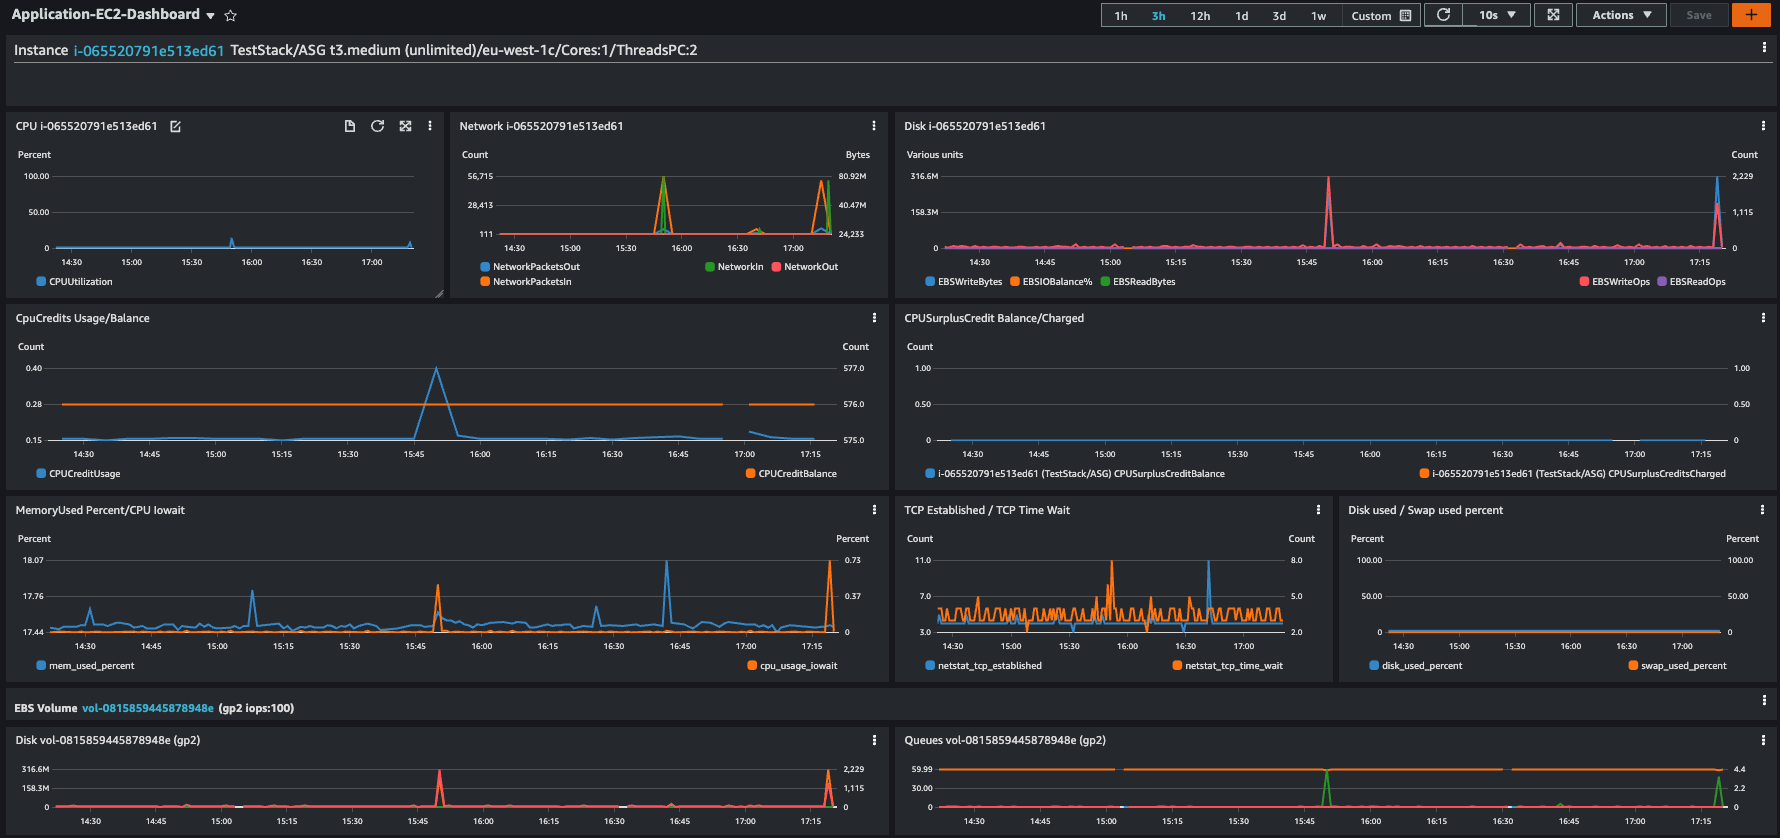
Figure 6. Burstable EC2 Instance with CloudWatch agent
Network dashboard - TGW view
- Metrics are shown on TGW and on attachment level
Type of attachment is shown
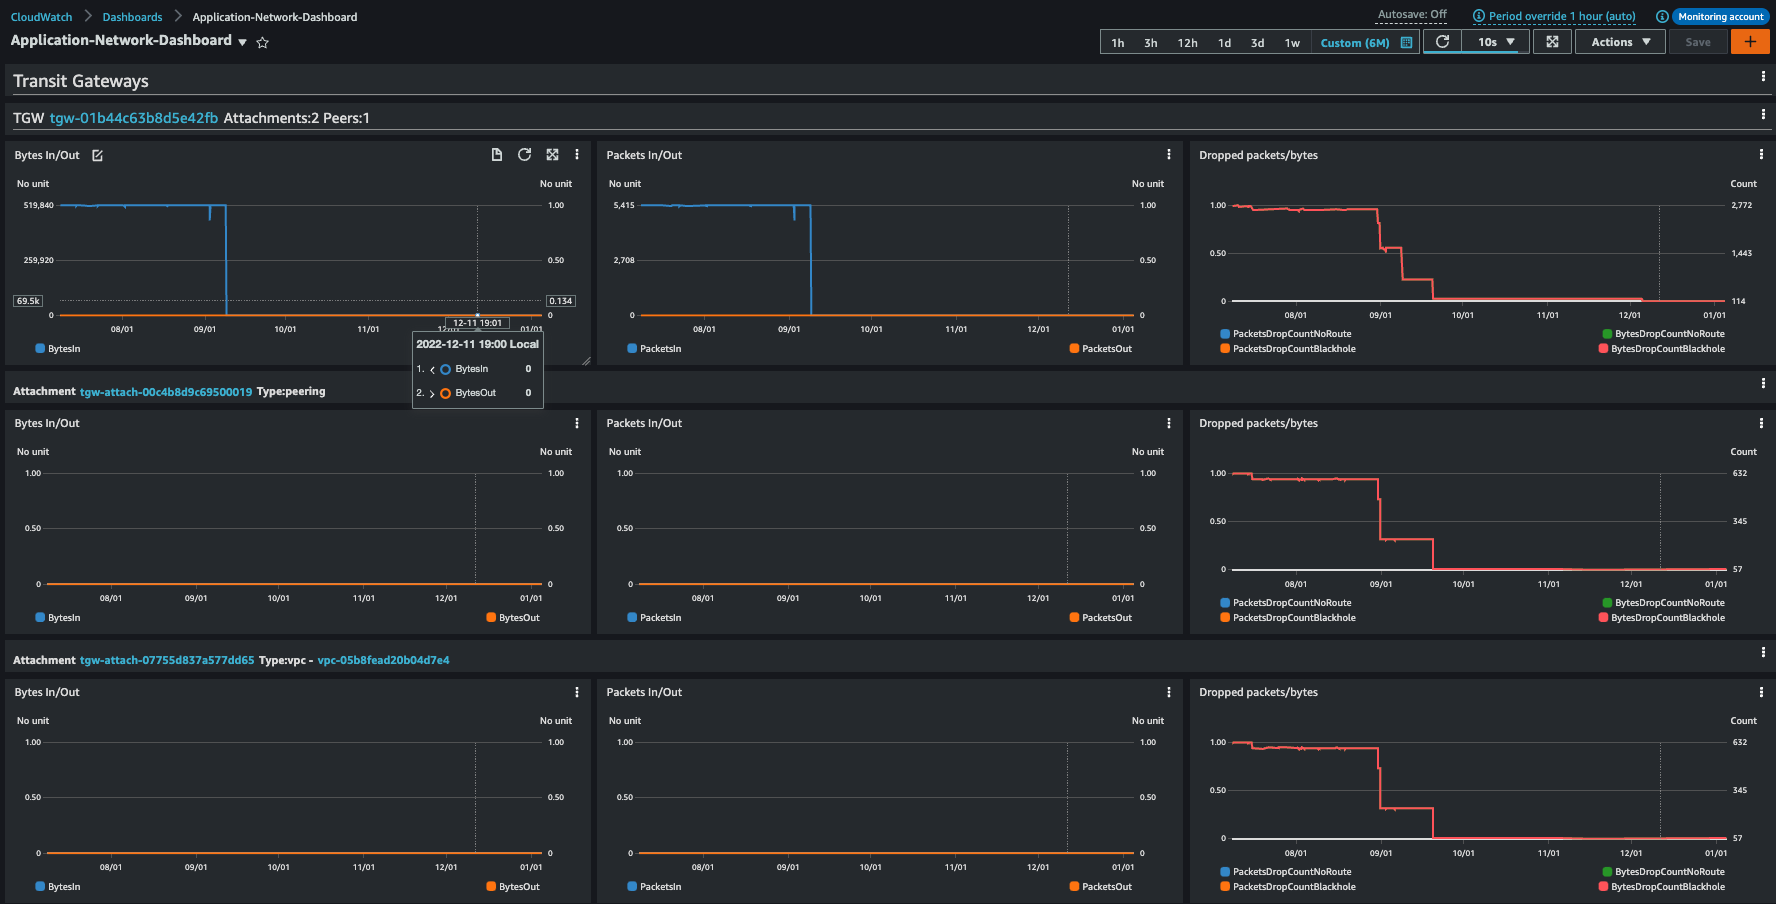
Figure 7. Networking Dashboard - TGW view
Uninstall the Guidance
You can uninstall the Guidance for Network Monitoring components from the AWS Management Console or by using the AWS Command Line Interface.
To uninstall, run cdk destroy in the Guidance for Network Monitoring code root folder from which you deployed it previously.
If CDK is not used to deploy other resources to this account then “bootstrap” resources can be removed also.
Do not do this if you think other users might be using CDK to deploy to this AWS account.
To remove the bootstrap resources simply navigate to AWS CloudFormation console, select Stacks and locate the Stack with name CDKToolkit. Delete CDKToolkit Stack.
Contributors
Zoran Pucar, Pr. TAM AWS Enterprise Support
Daniel Zilberman, Sr. SA AWS Technical Solutions
Notices
Customers are responsible for making their own independent assessment of the information in this document. This document: (a) is for informational purposes only, (b) represents AWS current product offerings and practices, which are subject to change without notice, and (c) does not create any commitments or assurances from AWS and its affiliates, suppliers or licensors. AWS products or services are provided “as is” without warranties, representations, or conditions of any kind, whether express or implied. AWS responsibilities and liabilities to its customers are controlled by AWS agreements, and this document is not part of, nor does it modify, any agreement between AWS and its customers.