Guidance for Meter Data Analytics on AWS
Summary: This guide covers the information you need to deploy "Guidance for Meter Data Analytics on AWS" in your AWS environment.
Refer to the GitHub repository to view source files, report bugs, submit feature ideas, and post feedback about this Implementation Guide. To comment on the documentation, refer to Feedback.
This implementation guide provides an overview of the "Guidance for Meter Data Analytics on AWS," its reference architecture and components, considerations for planning the deployment, and configuration steps for deploying to Amazon Web Services (AWS). This guide is intended for solution architects, business decision makers, DevOps engineers, data scientists, and cloud professionals who want to implement "Guidance for Meter Data Analytics on AWS" in their environment.
Overview
This guide covers the information you need to deploy “Guidance for Meter Data Analytics on AWS” in your AWS environment.
Costs and licenses
This implementation guide is offered to users at no cost. However, if you deploy “Guidance for Meter Data Analytics to AWS” in your environment, you will be billed for any AWS services or resources you use in the deployment.
Architecture
Deploying this Guidance with default parameters builds the Meter Data Analytics (MDA) environment in the AWS Cloud, as shown in Figure 1.
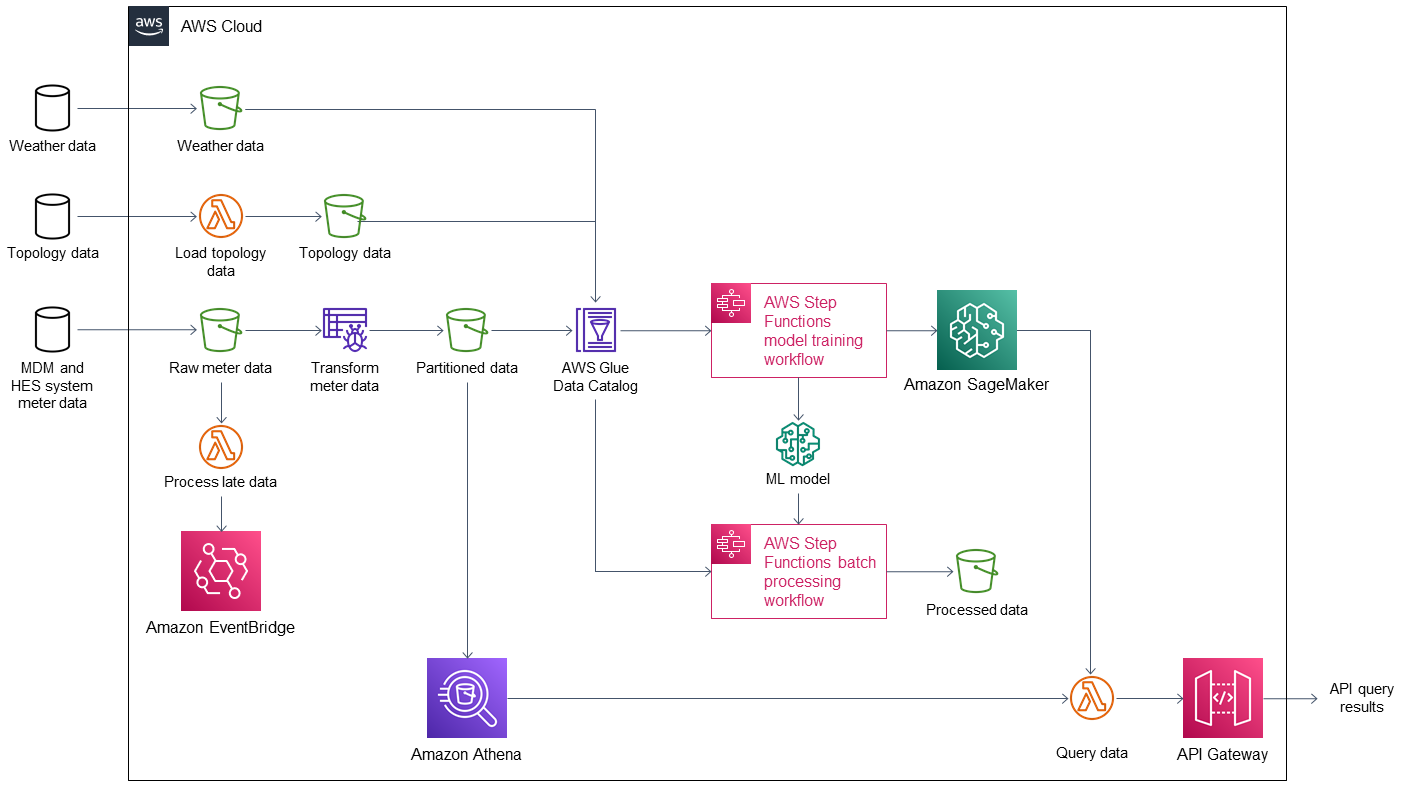
Figure 1. Solution architecture for Meter Data Analytics on AWS.
This Guidance sets up the following services:
Amazon Simple Storage Service (Amazon S3) buckets to store:
Weather and topology data from external databases.
Raw meter data.
Partitioned data.
Processed data from the AWS Step Functions model training workflow.
AWS Lambda functions to:
Load and transform topology data from an external database.
Process late-arriving meter data.
Obtain API query results of partitioned business data and Amazon SageMaker inferences.
An AWS Glue crawler to transform meter data from the meter data management (MDM) system and headend system (HES) system into partitioned data.
Amazon EventBridge to process and store late-arriving meter data in the correct partition.
AWS Glue Data Catalog for a central catalog of weather, topology, and meter data.
Amazon Athena to provide query results of partitioned data.
Two Step Functions workflows:
Model training to build a machine learning (ML) model using partitioned business data.
Batch processing of partitioned business data from the Data Catalog and ML model data for use in forecasting.
SageMaker to generate energy usage inferences using the ML model.
Amazon API Gateway to manage API queries.
Deployment options
This Guidance provides one deployment option:
- Manual deployment – Build and deploy in your AWS account
o Steps to build and deploy are in the MDA GitHub repository .
This Guidance lets you configure instance types and MDA settings.
Predeployment steps
Meter data generator and HES simulator
The input adapter regularly pulls data from the HES simulator and prepares the data for further processing. During deployment, you can choose to deploy the meter data generator and HES simulator stacks by choosing ENABLED for the MeterDataGenerator parameter. You also configure the number of meters and the interval between meter reads with the TotalDevices and GenerationInterval parameters, respectively. The default values for these parameters generate 10,000 reads every 15 minutes.
Deployment steps - using CFN
For detailed instructions visit the MDA repository.
Postdeployment steps
Set up Amazon Managed Grafana dashboards
This Guidance includes a set of Amazon Managed Grafana dashboards. These dashboards use Athena to query data stored in a data lake and depend on several of the optional datasets for full functionality.
Amazon Managed Grafana supports Security Assertion Markup Language (SAML) and IAM Identity Center for authentication. If your organization does not have SAML or IAM Identity Center set up, consult your administrator.
Create a Grafana workspace
In the Amazon Managed Grafana console, choose Create workspace.
Enter a Workspace Name (for example, mda_solution). If desired, enter an optional Workspace Description.
Choose Next.
On the Configure Settings page, for Authentication access, select Security Assertion Markup Language (SAML).
For Permission type, choose Service managed.
Choose Next.
On the Service managed permission settings page, for IAM permission access settings, choose Current account.
For Data sources and notification channels, select Amazon Athena.
Choose Next.
Choose Create workspace.
Select/Create SSO users and groups
After creating a Grafana workspace, select the single sign-on (SSO) users and groups with whom you want to share access. For more information, refer to Managing user and group access to Amazon Managed Grafana.
If you don’t already have users and groups setup in IAM Identity Center, follow these steps to create a user to be used with Grafana:
In a new tab or browser window, navigate to the IAM Identity Center in AWS Console.
Select Users in the left panel.
Select Add user button on the right panel.
Add a user you would like to use for testing, as shown in Figure 2 below.
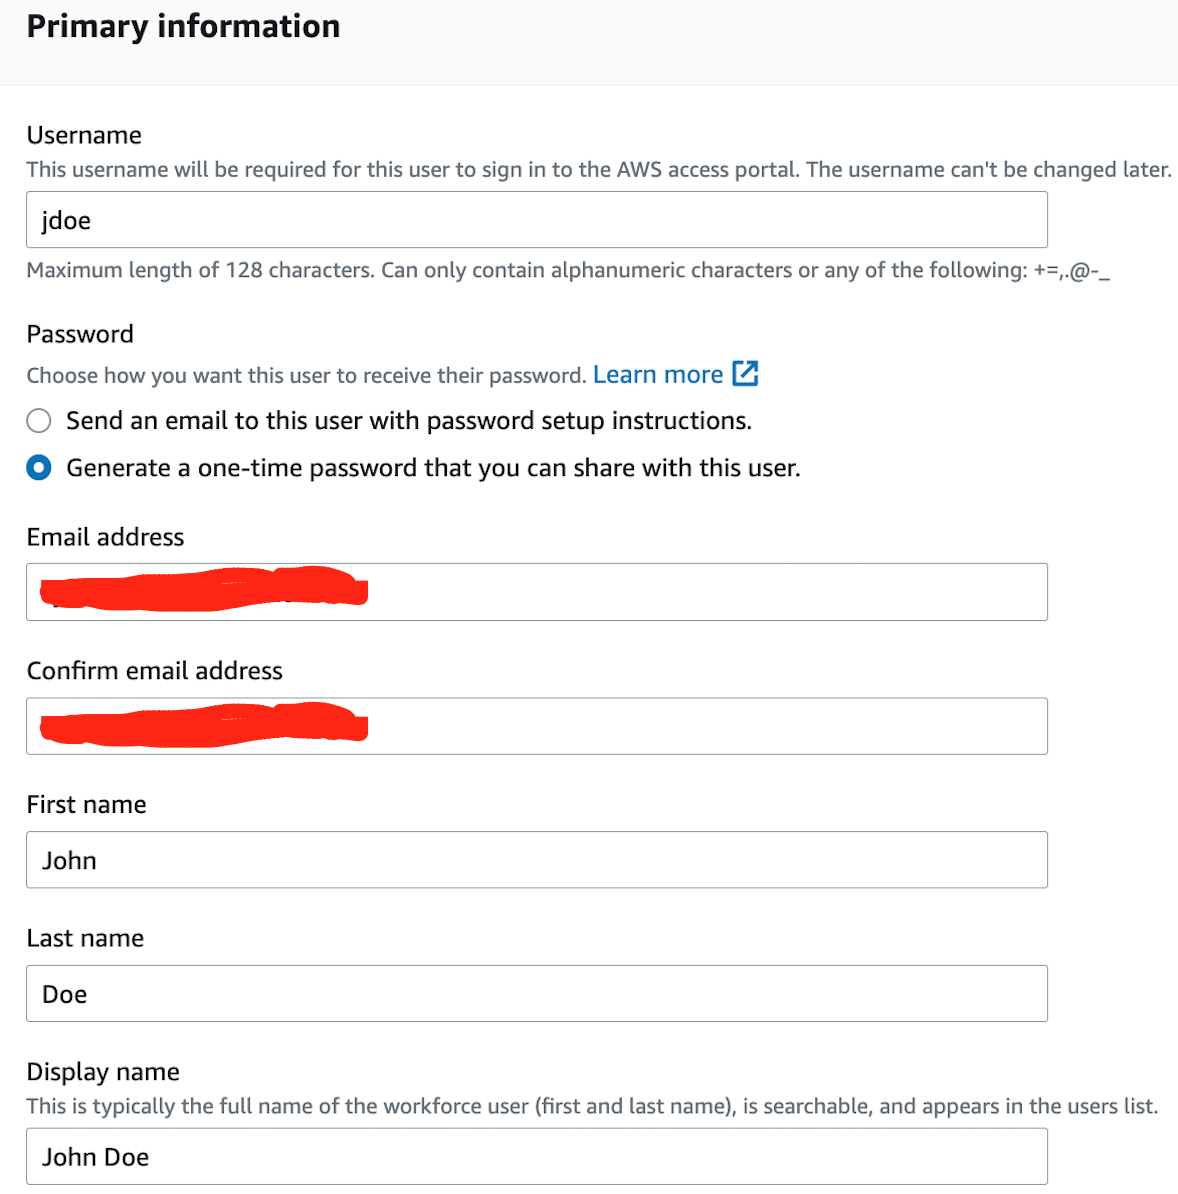
Figure 2. Screenshot showing how to add a user for testing.
Choose Next at the bottom of the screen.
Choose Next again in the group creation screen.
Choose Add user button to create the user.
Choose Copy to copy the URL and login details for later use.
Assign SSO user to access Grafana
To give an SSO user access to Grafana, follow these steps:
In the Grafana tab, choose the workspace mda_solution that was created.
Confirm you are in the Authentication tab.
Choose Assign new user or group button.
Select the checkbox next to the user that was created in the IAM Identity Center.
Select the button Assign users and groups.
Select the checkbox next to the user, and then select the Action dropdown.
Select Make admin.
To access the workspace, follow these steps:
Navigate to the URL that was saved when the user was created in IAM Identity Center.
Log in using the saved username and password.
You will be prompted to update the password the first time you log in.
Select the Amazon Grafana panel to open Grafana, as shown in Figure 3.
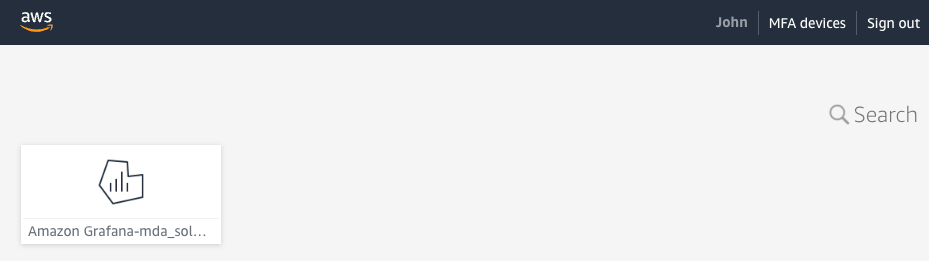
Figure 3. Screenshot showing Grafana in the Amazon Grafana panel.
Set up Amazon Athena as a data source in Grafana
Follow these steps to confirm Amazon Athena is added as a data source in Amazon Managed Grafana:
Select Configuration (cog icon), and then select Data sources.
Validate that you can see the data sources for Athena shown in Figure 4.

Figure 4. Screenshot showing data sources for Athena.
If you run into issues, refer to Amazon Athena and Data Source Management.
Import dashboards into Amazon Managed Grafana
Upload or paste the contents of dashboard JSON files from the /scripts/assets/grafana folder of the solution’s repository to Amazon Managed Grafana.
Follow these steps to upload the dashboard JSON:
Select the + icon, and then select Import.
Select Upload JSON file to upload each JSON file.
For more information, refer to Importing a dashboard.
Follow these steps to view the imported dashboards:
Select the Dashboards icon, and then select Browse.
You should see all the imported dashboards. Select each dashboard to view.
After importing, you may need to verify that the names of dashboard panel data sources match AWS Glue database names. If you receive errors, check panel data sources and variables in dashboard settings. For more information, refer to Adding or editing a panel and Dashboards.
Input adapter
As shown in Figure 5, the Guidance’s input adapter loads meter reads from an external source (such as HES or FTP) and prepares them for processing.
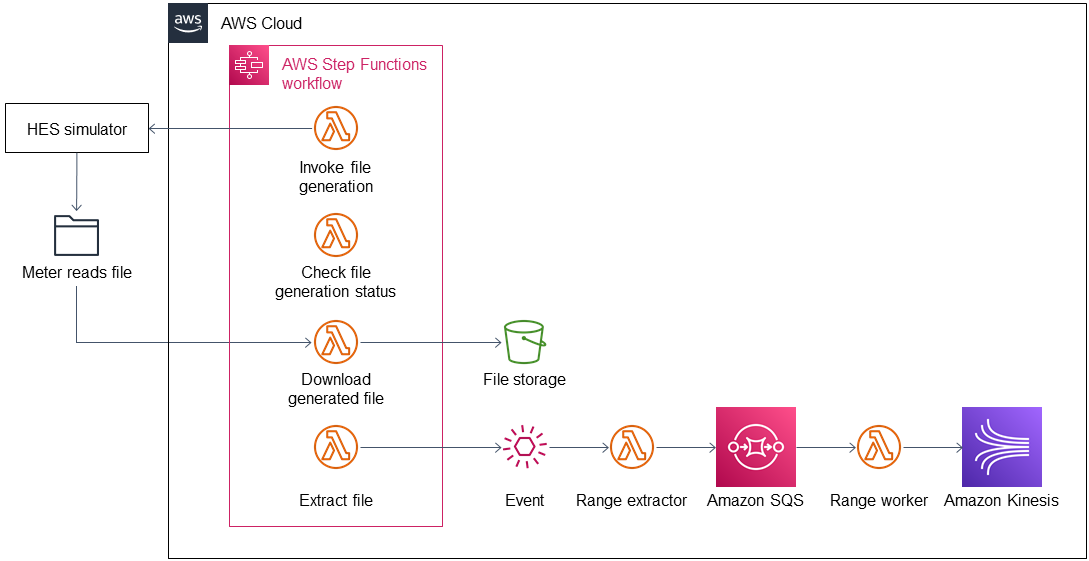
Figure 5. Input adapter
A Step Functions workflow orchestrates the generation and download of the meter-reads file as a compressed file from the external database to the inbound bucket. Another process extracts the file from the inbound bucket and stores it in the uncompressed folder. The inbound bucket stores the compressed and uncompressed files. The Guidance deletes uncompressed files to save on storage and costs.
After the file is extracted, the Guidance generates an event that invokes a Lambda function for further processing. The file-range-extractor Lambda function extracts range information from the uncompressed file based on the file size and number of chunks (configurable). A range is a group of lines that you want to process together. Extracted range information is sent to Amazon Simple Queue Service (Amazon SQS).
Each worker takes a range from the Amazon SQS queue and processes the respective meter reads (parse and transform) before sending each element to Amazon Kinesis. This process ensures that the content input file can be processed in parallel. The worker transforms the CSV line into JSON and creates a separate object for each reading type. The Amazon Kinesis data stream ingests the data into the staging area. This stream scales on demand.
Dataflows
You can set up connections to other data sources by configuring additional dataflows. As shown in Figure 6, a dataflow connects to the external database, loads data from it, and stores data in a purpose-built database that can be accessed from the Guidance’s central data catalog.
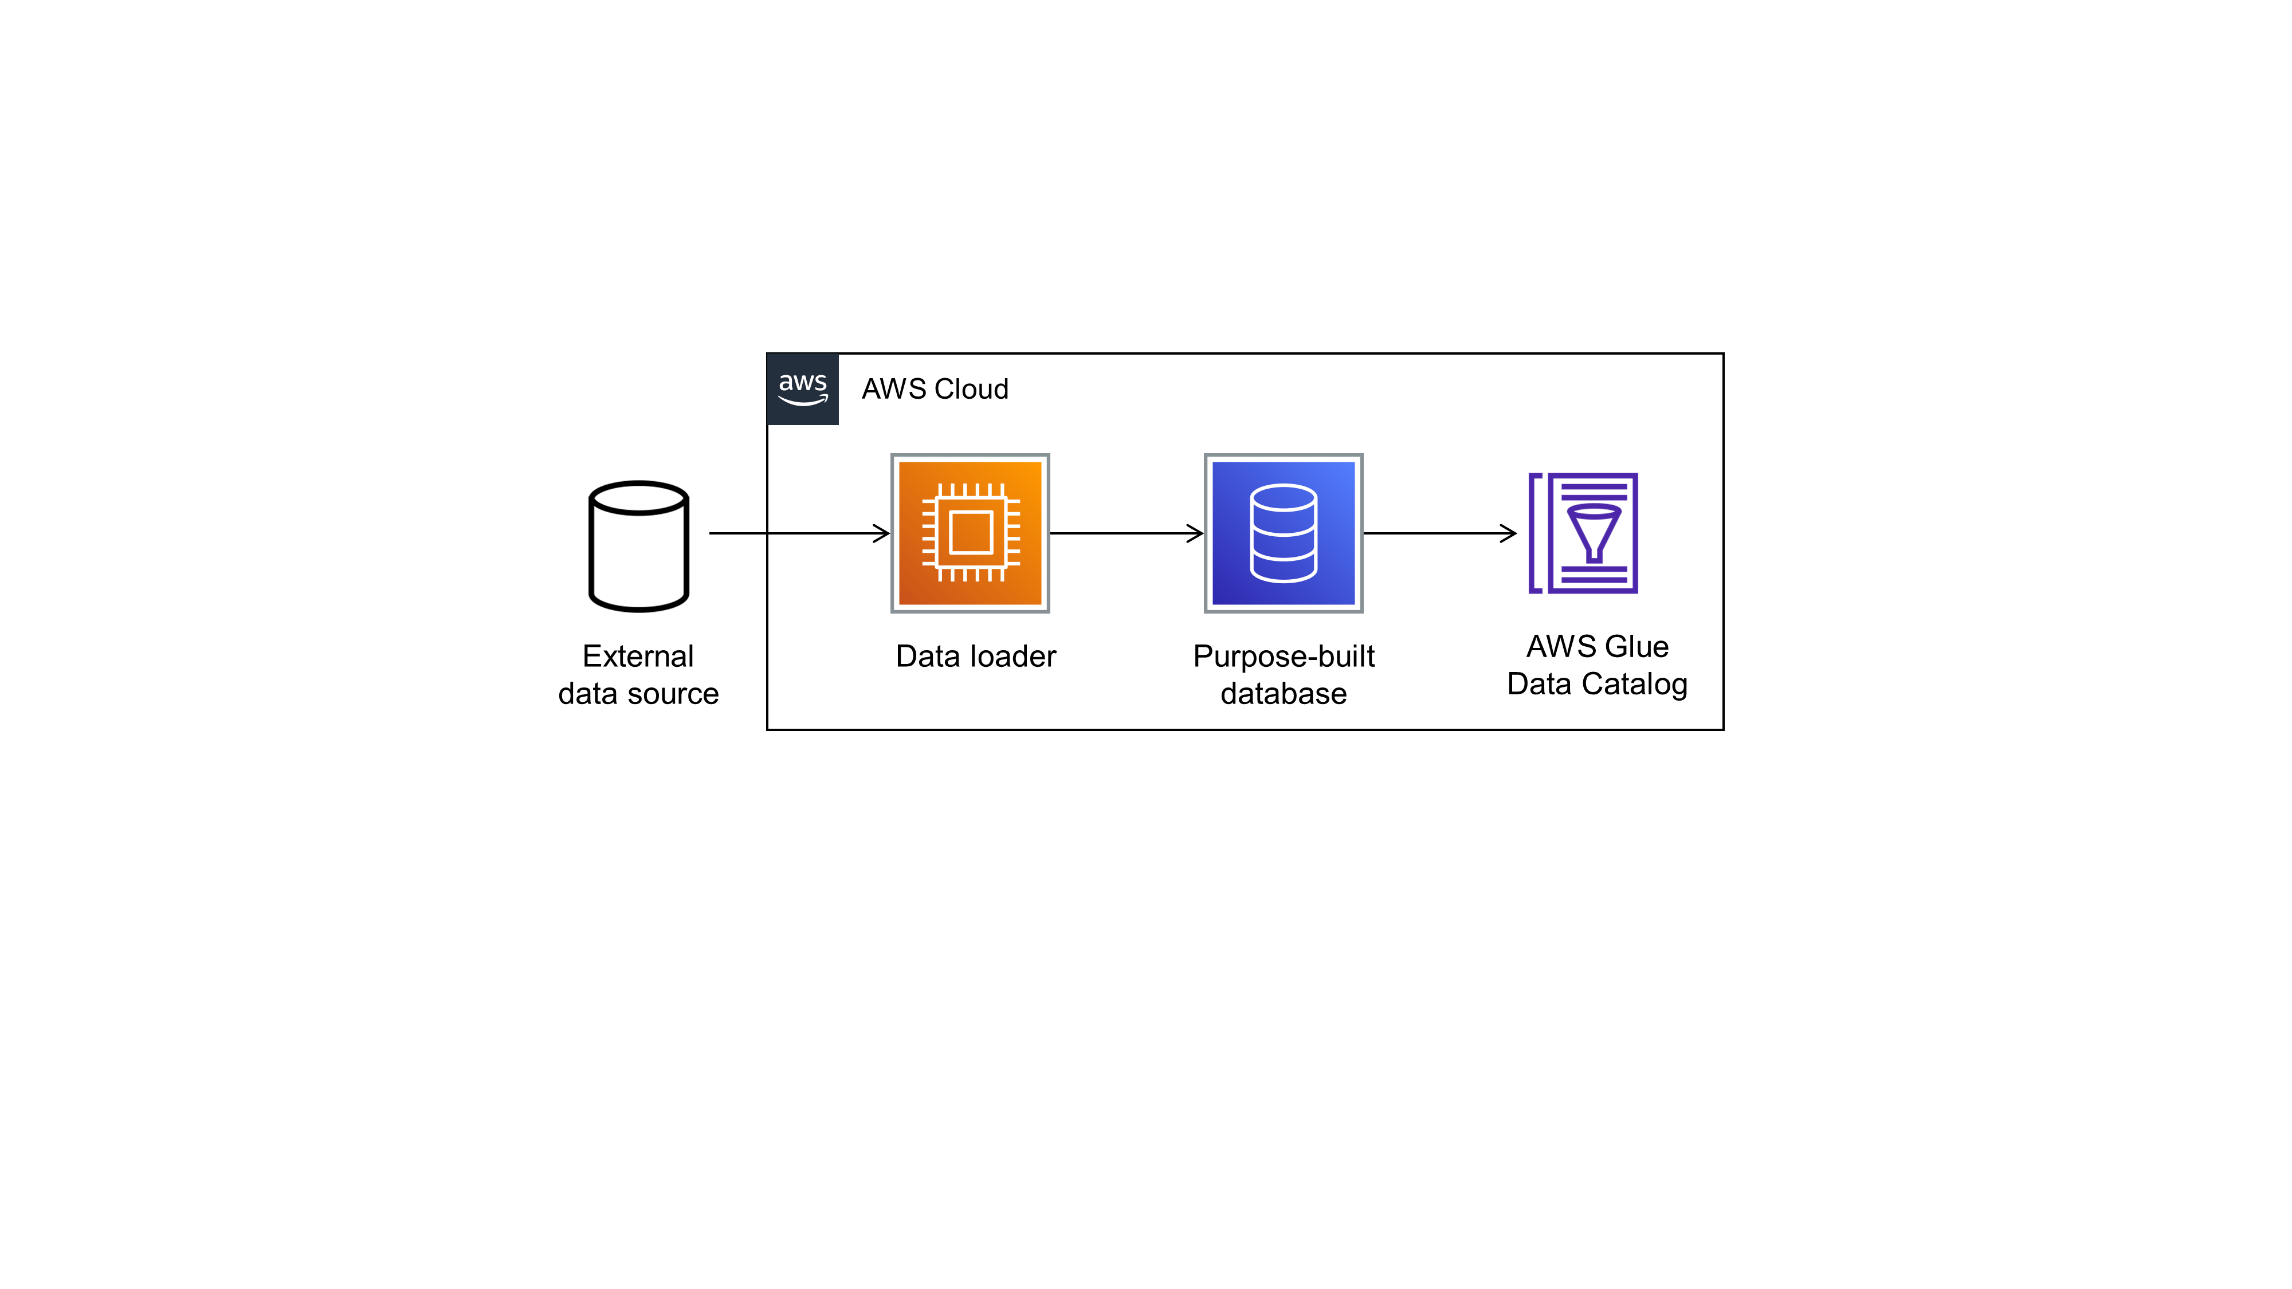
Figure 6. Dataflow
The Guidance comes with two sample dataflows: weather and topology. To add a new dataflow, create a data pipeline that loads data from the source, prepares the data, and stores results in an appropriate data store. Then, add the data store you’ve configured to the Guidance’s data catalog.
Data partitioning
The weather data is partitioned in the S3 bucket s3://gen-disabled-aws-utility-met-integrateddatabucket-\*/weather/date=\<year\>-\<month\>-\<day\>/\<data-file-in-parquet-format\>
The topology data is stored in the S3 bucket s3://gen-disabled-aws-utility-met-integrateddatabucket-\*/topology/
The curated data in the integration stage S3 bucket is partitioned by reading type, year, month, day, and hour, as follows:
s3://\*-integrateddatabucket-\*/readings/parquet/reading_type=\<reading_type_value\>/year=\<year\>/month=\<month\>/day=\<day\>/hour=\<hour\>/\<meter-data-file-in-parquet-format\>
You can find all meter reads for the hour of a day on the lowest level of the partition tree. To optimize query performance, the data is stored in a column-based file format (Parquet).
Late-arriving data
The data lake handles late-arriving meter reads. Late-arriving meter reads are detected as soon as the data reaches the staging phase. If a late read is detected, an event is sent to Amazon EventBridge. The extract, transform, load (ETL) pipeline moves the late read to the correct partition and ensures that data is stored in an optimized way.
Data formats
Table 1 shows inbound schema.
| Field | Type | Format | Description |
|---|---|---|---|
| time | timestamp | yyyy-MM-dd HH:mm:ss.SSSSSSS | Timestamp when the meter read reaches the source system. |
| arrival_time | timestamp | yyyy-MM-dd HH:mm:ss.SSSSSSS | Timestamp of the actual meter read. |
| device_id | string | 7a044be7-2f1e-3bf1-aa86-b8b1b9064f19 | uuid |
| measure_name | string | ||
| load | double | 0.000 | Load, unit: A |
| crrnt | double | 0.000 | Current, unit: A |
| pf | double | 0.000 | Power factor, between 0 and 1 |
| vkva | double | 0.000 | Volt ampere, unit: VA |
| kw | double | 0.000 | Kilowatt, unit: kW |
| vltg | double | 0.000 | Voltage, unit: V |
Table 1. Inbound schema
Inbound format
The inbound meter-data format is variable and can be adjusted. The following shows the sample inbound data format of the meter data generator.
Integrated format
Data are stored in the format shown in Table 2 in the integration stage.
| Field | Type | Format |
|---|---|---|
| meter_id | String | |
| reading_value | Double | 0.000 |
| reading_date_time | Timestamp | yyyy-MM-dd HH:mm:ss.SSS |
| unit | String | |
| obis_code | String | |
| phase | String | |
| reading_source | String | |
| reading_type | String (Partitioned) | load, crrnt, pf, kva, kw, vltg |
| year | String (Partitioned) | |
| month | String (Partitioned) | |
| day | String (Partitioned) | |
| hour | String (Partitioned) |
Table 2. Integration schema
Troubleshooting
For common troubleshooting issues, visit Troubleshooting CloudFormation.
Customer responsibility
After you deploy a Guidance, confirm that your resources and services are updated and configured—including any required patches—to meet your security and other needs. For more information, refer to the Shared Responsibility Model.
Feedback
To submit feature ideas and report bugs, use the Issues section of the GitHub repository for this Guidance.
Notices
This document is provided for informational purposes only. It represents current AWS product offerings and practices as of the date of issue of this document, which are subject to change without notice. Customers are responsible for making their own independent assessment of the information in this document and any use of AWS products or services, each of which is provided "as is" without warranty of any kind, whether expressed or implied. This document does not create any warranties, representations, contractual commitments, conditions, or assurances from AWS, its affiliates, suppliers, or licensors. The responsibilities and liabilities of AWS to its customers are controlled by AWS agreements, and this document is not part of, nor does it modify, any agreement between AWS and its customers.
The software included with this paper is licensed under the Apache License, version 2.0 (the "License"). You may not use this file except in compliance with the License. A copy of the License is located at https://aws.amazon.com/apache2.0/ or in the accompanying "license" file. This code is distributed on an"as is" basis, without warranties or conditions of any kind, either expressed or implied. Refer to the License for specific language governing permissions and limitations.
Privacy| Site terms| © 2023, Amazon Web Services, Inc. or its affiliates and Amazon Web Services. All rights reserved.