Guidance for Event-Driven Application Autoscaling with KEDA on Amazon EKS
Summary: This implementation guide provides an overview of Guidance for Event-Driven Application Autoscaling with KEDA on Amazon EKS and provides step-by-step instructions detailing how to integrate KEDA with Amazon EKS applications. Additionally, this implementation guide shows how to scale deployments based on custom metrics.
Overview
This implementation guide dives deep into the concepts of Kubernetes Event Driven Autoscaling (KEDA) and provides examples. As part of this guide, you will also learn how using KEDA can lower compute cost scaling Kubernetes Pods based on events like the number of messages in Amazon Simple Queue Service (Amazon SQS) or customized metrics from Amazon Managed Service for Prometheus.
Features and benefits
KEDA is a single-purpose and lightweight component that can be added into any Kubernetes cluster. KEDA works alongside standard Kubernetes components like the Horizontal Pod Autoscaler (HPA) and can extend functionality without overwriting or duplication. Currently, KEDA has over 60 scalers available to detect if a deployment should be activated or deactivated in addition to feed custom metrics for a specific event source.
The current default Kubernetes scaling mechanism is based on CPU and memory utilization and is not efficient enough for event-driven applications. These mechanisms lead to over or under provisioned resources that might generate a poor cost efficiency or customer experience. KEDA enables scaling based on custom metrics. The custom metrics may include business metrics, like the amount of orders or payments waiting to be processed, or technical metrics, like the number of concurrent requests or response time.
Use cases
KEDA allows you to automatically scale workloads based on events from various sources like queues, streams, metrics scrapers, and more. In this Guidance, we will cover two main use cases:
Scaling application with KEDA based on Amazon SQS Queues: Using KEDA with Amazon SQS queues is a useful combination for workloads that need to process messages from Amazon SQS. As messages build up in the Amazon SQS queue, KEDA can automatically scale up pods to handle increased load by processing more messages in parallel from the queue. Once the queue length drops back down and messages have been consumed, KEDA can scale the pods back down to save resources. This allows workloads based on SQS messages to run cost-effectively on Kubernetes through KEDA’s integration with the Amazon SQS API.
Scaling application with KEDA based on custom metrics from Amazon Managed Services for Prometheus: KEDA can use Amazon Managed Service for Prometheus to autoscale workloads based on Prometheus metrics. For example, you can configure KEDA to scale out a set of pods whenever there is an increase in request count metric exposed by Prometheus. Using KEDA with Amazon Managed Service for Prometheus gives you an easy way to implement autoscaling based on custom application metrics without having to manage the Prometheus server yourself.
Architecture Overview
This section provides a reference implementation architecture diagram for the components deployed with this Guidance.
Architecture diagram
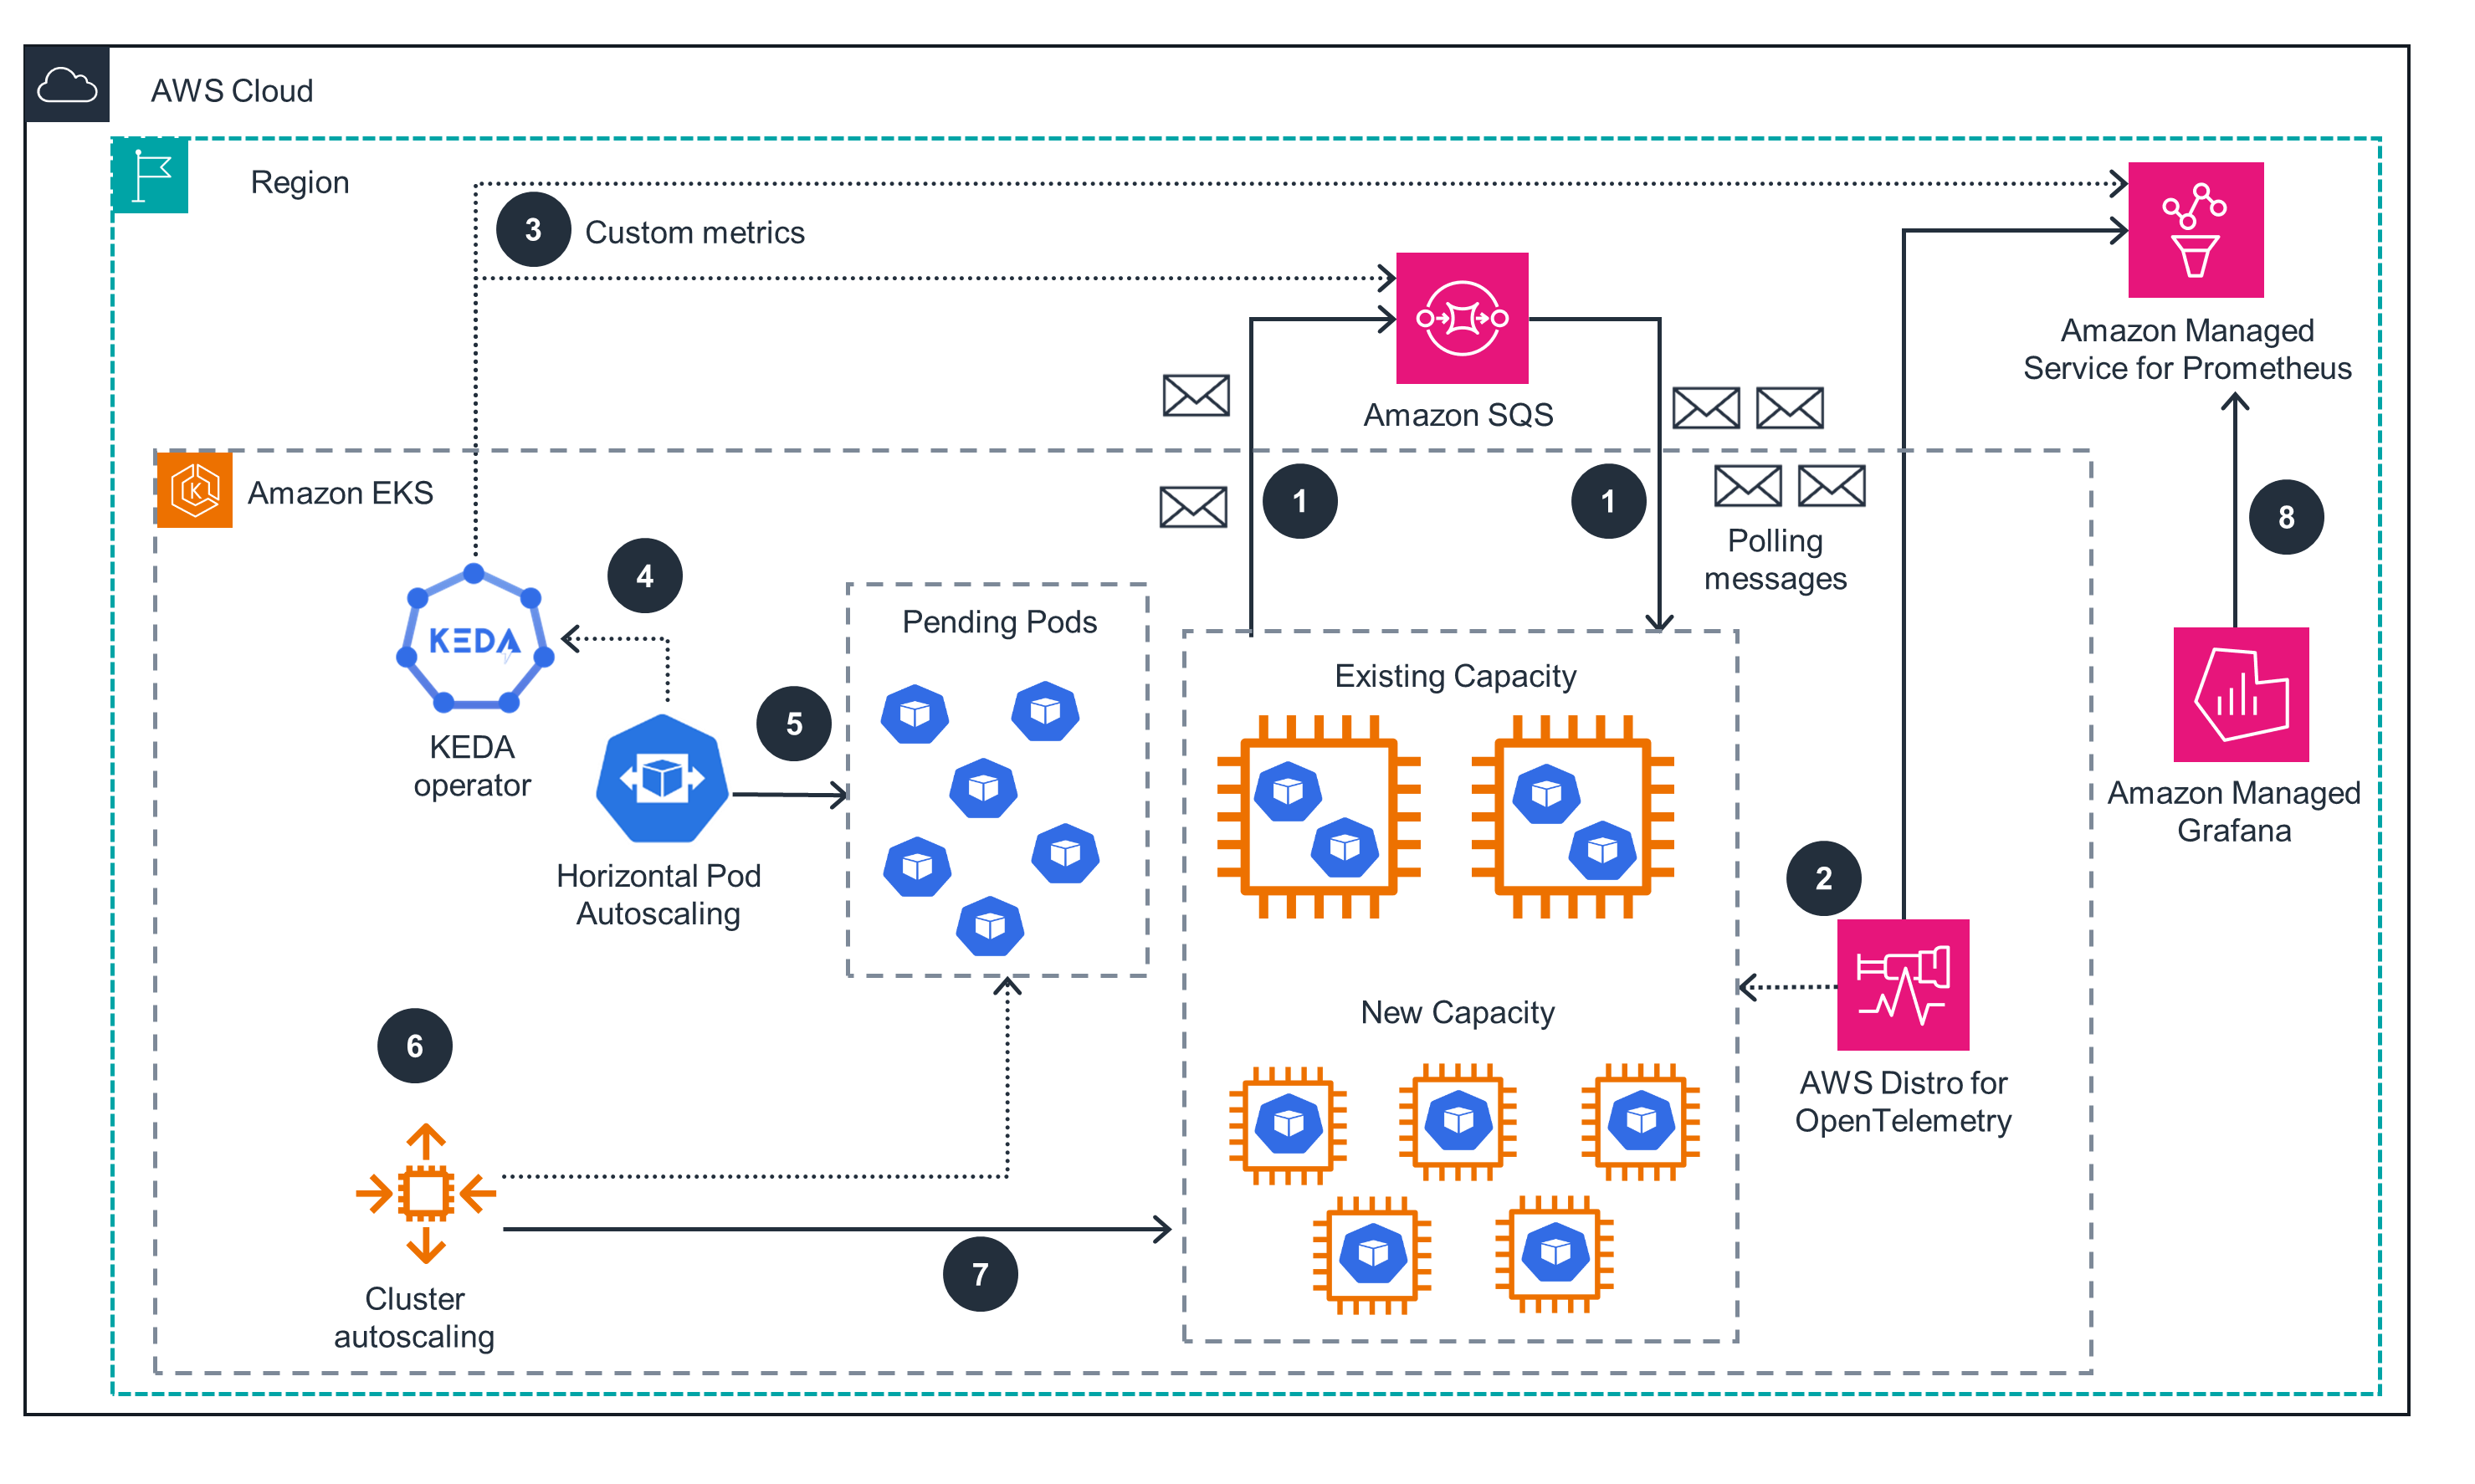
Figure 1: KEDA architecture on AWS
Architecture steps
- The app uses Amazon SQS to decouple communication between microservices.
- AWS Distro for OpenTelemetry gets metrics from the application and sends them to Amazon Managed Service for Prometheus.
- KEDA is configured to use Amazon SQS and the Amazon Managed Service for Prometheus scaler to get Amazon SQS queue length and Prometheus custom metrics.
- KEDA (keda-operator-metrics-apiserver) exposes event data for HPA to scale.
- HPA scales to the appropriate number of pods.
- Cluster Autoscaling (CA) provisions the required nodes using auto scaling group. Instead of CA, you can also use Karpenter.
- New capacity is provisioned as required.
- You can optionally configure Amazon Managed Grafana to show metrics from Amazon Managed Service for Prometheus in a dashboard.
AWS services in this Guidance
| AWS service | Description |
|---|---|
| Amazon Elastic Kubernetes Service (Amazon EKS) | Core - Used to provide a managed Kubernetes environment to run our applications and KEDA components |
| Amazon Elastic Compute Cloud (Amazon EC2) | Core - Used to provide compute capacity for Kubernetes nodes |
| Amazon Elastic Container Registry (Amazon ECR) | Core - Used to store and provide container artifacts |
| Amazon SQS | Core - Used to receive messages that KEDA will use to scale our Kubernetes pods |
| Amazon Managed Service for Prometheus | Core - Used to store custom metrics that KEDA will use to scale our Kubernetes pods |
| AWS Distro for OpenTelemetry | Supporting - Used to scrape and export metrics from applications to Amazon Managed Service for Prometheus |
| AWS Identity and Access Management (IAM) | Supporting - Used to control access from pods to AWS services through the IAM Role for Service Account feature |
| AWS Cloud9 | Supporting - Used as a Cloud IDE to interact with AWS and Kubernetes APIs |
| Amazon Managed Grafana | Optional - Used to show Prometheus metrics |
Plan your Deployment
Cost
You are responsible for the cost of the AWS services used while running this Guidance. As of April 2024, the cost for running this Guidance with the default settings in the US West (Oregon) is approximately $ 302.24 per month.
Refer to the pricing webpage for each AWS service used in this Guidance.
We recommend creating a budget through AWS Cost Explorer to help manage costs. Prices are subject to change. For full details, refer to the pricing webpage for each AWS service used in this Guidance.
Cost table
The following table provides a sample cost breakdown for deploying this Guidance with the default parameters in the US West (Oregon) Region for one month.
| AWS service | Dimensions | Cost [USD] |
|---|---|---|
| Amazon EKS | 1 managed control plane | $ 0.10 per hour |
| Amazon EC2 | 2 or 3 m5.large instances | $ 0.096 per instance per hour |
| Amazon ECR | Less than 1GB of storage | $ 0.10 per GB per month |
| Amazon SQS | Less than 1 million requests | $ 0.40 per million |
| Amazon Managed Service for Prometheus | Less than 10M samples ingested and less than 1GB storage | $ 0.90 per 10M samples + $ 0.03 per GB per Month |
| AWS Cloud9 | 1 t2.micro Linux instance | $ 0.0116 per hour + $ 0.10 per GB per month of provisioned storage |
| Amazon Managed Grafana | Optionally, 1 Editor license | $ 9 per user per month |
Security
When you build systems on AWS infrastructure, security responsibilities are shared between you and AWS. This shared responsibility model reduces your operational burden because AWS operates, manages, and controls the components including the host operating system, the virtualization layer, and the physical security of the facilities in which the services operate. For more information about AWS security, visit AWS Cloud Security.
| AWS services security features | Description |
|---|---|
| IAM Roles for Service Account | Allows pods to securely access AWS resources using IAM roles |
| Amazon Virtual Private Cloud (Amazon VPC) Security Groups | Protects ingress and egress communication between AWS resources such as EC2 instances (EKS nodes) |
| AWS SigV4 | Sign AWS API calls made by anonymous users or applications |
Supported AWS Regions
This Guidance optionally uses Amazon Managed Grafana and Amazon Managed Service for Prometheus, which is not currently available in all AWS Regions. For the most current availability of AWS services by Region, refer to the AWS Regional Services List.
Guidance for Event Driven Application Autoscaling with KEDA on Amazon EKS is supported in the following AWS Regions:
| Region Name | |
|---|---|
| US East (Ohio) | Asia Pacific (Tokyo) |
| US East (N. Virginia) | Europe (Frankfurt) |
| US West (Northern California) | Europe (Ireland) |
| US West (Oregon) | Europe (London) |
| Asia Pacific (Mumbai) | Europe (Paris) |
| Asia Pacific (Seoul) | Europe (Stockholm) |
| Asia Pacific (Singapore) | South America (São Paulo) |
| Asia Pacific (Sydney) |
Quotas
Service quotas, also referred to as limits, are the maximum number of service resources or operations for your AWS account.
Quotas for AWS services in this Guidance
Make sure you have sufficient quota for each of the services implemented in this solution. For more information, see AWS service quotas.
To view the service quotas for all AWS services in the documentation without switching pages, view the information in the Service endpoints and quotas page in the PDF instead.
Prerequisites
Set up AWS Cloud9 environment
You can deploy the AWS Cloud9 instance and the IAM role instance profile by running the /setup/cloud9-instance-enviroment.yaml CloudFormation template.
The IAM role instance profile and the IAM policy attached will be created automatically, you only need to attach the IAM role instance profile named eks-keda-guidance-cloud9admin at the AWS Cloud9 instance after creation.
To deploy AWS Cloud9 manualy follow below steps:
After you sign in to the AWS Cloud9 console, in the top navigation bar choose an AWS Region to create the environment in, as shown in Figure 2.
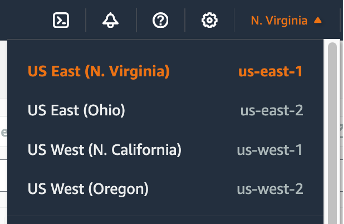
Figure 2: Dropdown showing available AWS Regions to select.
Choose the Create environment button in the next screen, and provide a Name. Leave other configurations on the default setting (or change your VPC settings), and select Create, as shown in Figures 3-5.
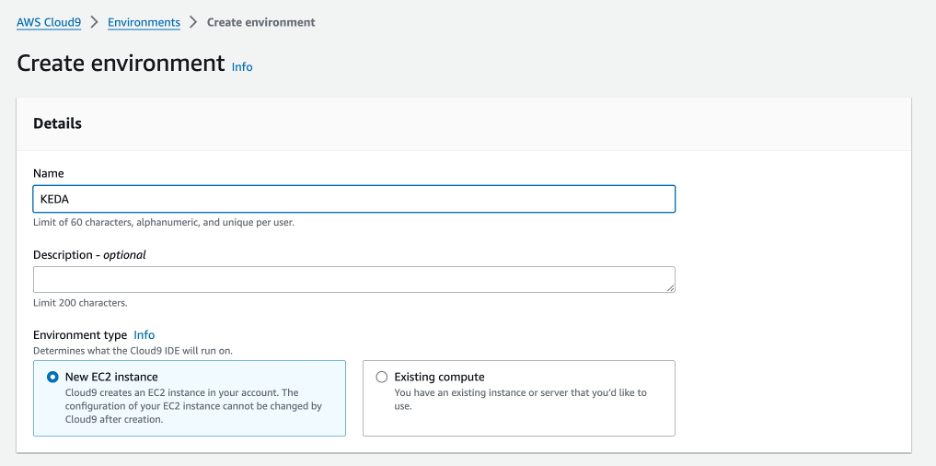
Figure 3: Provide a name in the text box.
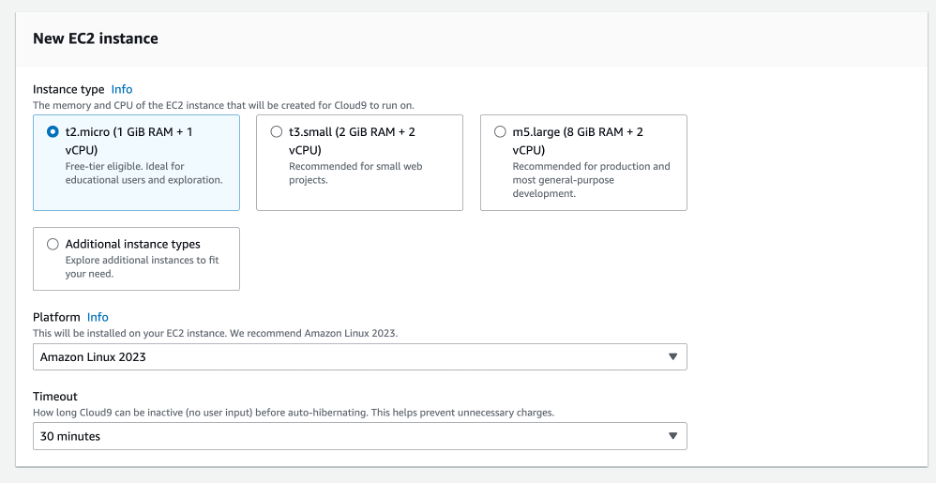
Figure 4: Select your instance type.

Figure 4: Select Create.
Once your EC2 environment is up and running, perform the remaining steps.
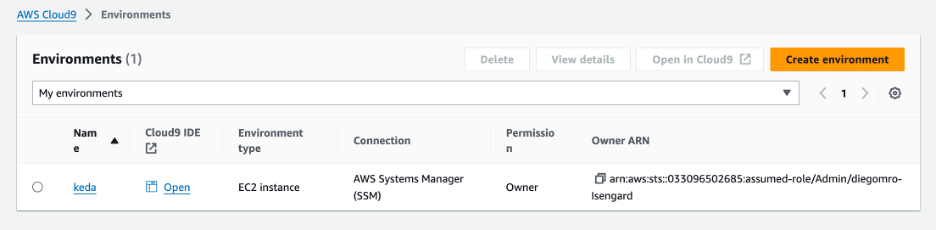
Figure 5: Once created, your EC2 environment will show up under the Environments tab.
- Create an IAM role for your Cloud9 workspace environment.
- Follow this link to create an IAM role with Administrator access
- Confirm that AWS service and EC2 are selected, then select Next to view permissions.
- Confirm that AdministratorAccess is checked, then select Next to review.
- Set the Role name as “eks-keda-guidance-cloud9admin”.
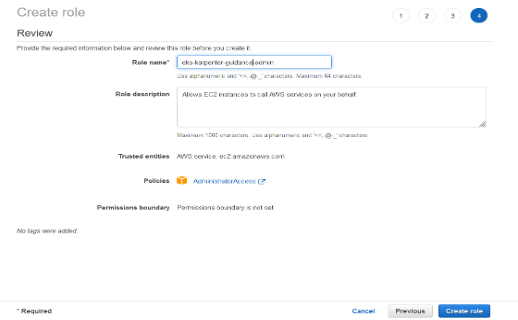
Figure 6: Create the IAM role.
Attach the IAM role to the Cloud9 workspace
- Follow this link to your Cloud9 ec2 instance and filter with the name of the instance.
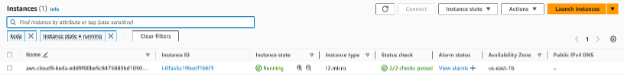
Figure 7: Create the IAM role.
- Select the instance, then choose Actions > Security > Modify IAM Role.
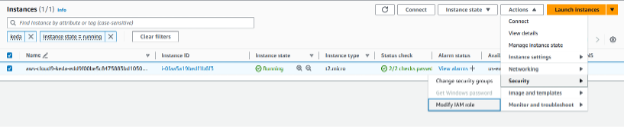
Figure 8: Use the dropdown to modify the IAM role.
- Choose eks-keda-guidance-cloud9admin from the IAM Role dropdown, and select Update IAM Role.
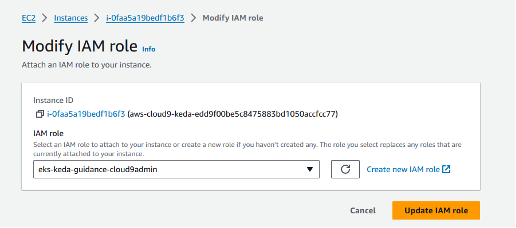
Figure 9: Use the dropdown to update the IAM role.
Check if Cloud9 AWS temporary credentials are disabled.
- Go to the Cloud9 console, and select Open to connect to your Cloud9 instance.
- Open the Preferences tab in the Cloud9 console on the top right.
- Open the AWS Settings and check if AWS Managed Temporary Credentials is Off. If not, turn it Off.
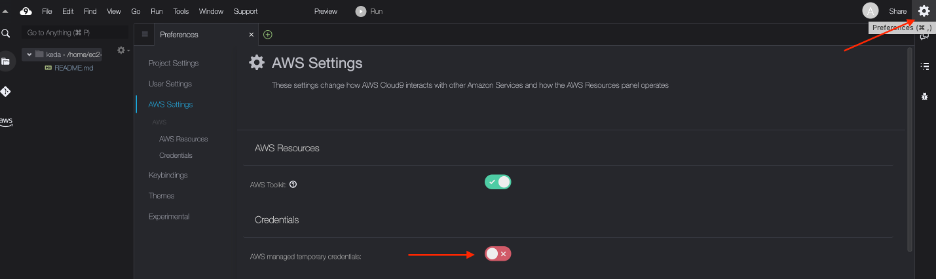
Figure 10: Turn off temporary credentials.
- Go to the Cloud9 terminal, and run the below command to remove any existing credentials files:
rm -vf ${HOME}/.aws/credentials
- Ensure you are getting the IAM role that you have attached to the Cloud9 integrated development environment (IDE) when you run the below command:
aws sts get-caller-identity --query Arn | grep eks-keda-guidance-cloud9admin -q && echo "IAM role valid" || echo "IAM role NOT valid"
If the IAM role is not valid, do not proceed. Go back and confirm the steps in this section.
Clone GitHub repository and install tools
Clone the GitHub repository to the Cloud9 environment you created.
git clone https://github.com/aws-solutions-library-samples/guidance-for-event-driven-application-auto-scaling-with-keda-on-amazon-eks.git
cd guidance-for-event-driven-application-auto-scaling-with-keda-on-amazon-eks
Run the commands below:
chmod +x setup/*.sh
./setup/tools.sh
The tools.sh script in the Cloud9 terminal will install the following tools and configure them:
- eksctl
- kubectl
- awscli
- Helm CLI
- jq, envsubst (from GNU gettext utilities) and bash-completion
To configure the tools, follow these steps:
- Install k9s a Kubernetes CLI to Manage Your Clusters in Style.
- Enable kubectl bash_completion.
- Verify the binaries are in the path and executable.
- Enable some kubernetes aliases.
- Configure aws cli with your current region as default.
- Save these into bash_profile.
Create an Amazon EKS cluster
Change the file “env.sh” CLUSTER_NAME accordingly to your needs. Run the below commands to set up environment variables and deploy the Amazon EKS cluster.
./setup/env.sh

source /home/ec2-user/.bashrc

eksctl create cluster -f setup/cluster.yaml
To create the IAM OIDC Identity Provider for the cluster, follow these steps:
eksctl utils associate-iam-oidc-provider --cluster $CLUSTER_NAME --approve

echo "export OIDC_ID=$(aws eks describe-cluster --name $CLUSTER_NAME --query 'cluster.identity.oidc.issuer' --output text | cut -d '/' -f 5)" >> /home/ec2-user/.bashrc && source /home/ec2-user/.bashrc
Test access to your Amazon EKS cluster by running the following command. The output will be a list of worker nodes.
kubectl get nodes
You will get the following output:
NAME STATUS ROLES AGE VERSION

ip-192-168-114-108.ec2.internal Ready <none> 14m v1.27.5-eks-43840fb

ip-192-168-86-125.ec2.internal Ready <none> 14m v1.27.5-eks-43840fb
Install KEDA
The below installation steps are curated from The KEDA Documentation.
- Create a KEDA namespace.
kubectl create namespace $KEDA_NAMESPACE
- Create KEDA Operator IAM Service Account.
First, create an IAM Role that will be associated with the KEDA operator service account. This service account will be used for the operator to talk with AWS services. Attach IAM policies to that role depending on the sources that KEDA will track for the scale of our applications. In this guide, we use Amazon SQS and Amazon Managed Service for Prometheus as example sources. We will attach the policy later. Run the below commands to create the IAM role.
envsubst < keda/trust-policy-keda-operator.json > /tmp/trust-policy-keda-operator.json && mv /tmp/trust-policy-keda-operator.json keda/trust-policy-keda-operator.json
aws iam create-role --role-name ${KEDA_OPERATOR_ROLENAME} --assume-role-policy-document file://keda/trust-policy-keda-operator.json
- Add the Kedacore Helm repo.
KEDA is installed in clusters with a helm chart. KEDA uses Custom Resource Definition (CRD) to declare its configuration. Custom Resources are extensions of the Kubernetes API. One of the premises of Kubernetes is the declarative aspect of its APIs. KEDA simplifies its configuration by adhering to that principle.
Use helm to deploy KEDA to the cluster.
helm repo add kedacore https://kedacore.github.io/charts
- Install the KEDA operator using Helm chart. Modify the keda-values.yaml to reflect your environment configurations like Pod Disruption Budget and Pod Affinity.
envsubst < keda/keda-values.yaml.template > keda/keda-values.yaml
helm install keda kedacore/keda --namespace ${KEDA_NAMESPACE} -f keda/keda-values.yaml
- Check the KEDA installation.
Check the KEDA helm version by using helm list command.
helm list -n ${KEDA_NAMESPACE}
Expected output:
NAME            NAMESPACE       REVISION        UPDATED                                 STATUS          CHART                   APP VERSION
keda    keda            1               2023-10-23 13:27:18.169884609 +0000 UTC deployed        keda-2.12.0     2.12.0
There should be at least three pods keda-operator, keda-operator-metrics-apiserver and keda-admission-webhook.
kubectl get pods -n ${KEDA_NAMESPACE}
Expected output:
NAME READY STATUS RESTARTS AGE

keda-admission-webhooks-6b4b4b64fc-gvzn7 1/1 Running 0 21m

keda-operator-7fdd98c445-b62bl 1/1 Running 1 (21m ago) 21m

keda-operator-metrics-apiserver-6c59564b97-2466r 1/1 Running 0 21m
Scaled Objects
Deployments and StatefulSets are the most common way to scale workloads with KEDA. It allows you to define the Kubernetes Deployment or StatefulSet that you want KEDA to scale based on a specified threshold. KEDA will monitor that service, and based on the events that occur, it will automatically scale your resource in and out accordingly.
Behind the scenes, KEDA acts to monitor the event source and feed that data to Kubernetes and the HPA to drive rapid scale of a resource. Each replica of a resource is actively pulling items from the event source. With KEDA and scaling Deployments and StatefulSet, you can scale based on events while also preserving rich connection and processing semantics with the event source (for example, in-order processing, retries, deadletter, and checkpointing).
What is a ScaledObject?
A ScaledObject represents the desired mapping between an event source, such as an Amazon SQS queue, a Kafka topic, or Prometheus metric and the Kubernetes Deployment, StatefulSet, or any Custom Resource that defines or scales a sub-resource.
apiVersion: keda.sh/v1alpha1
kind: ScaledObject
metadata:
  name: sqsconsumer-hpa
  namespace: keda-sqs-guidance
spec:
  scaleTargetRef:
    name: sqs-consumer-backend
  minReplicaCount: 0
  maxReplicaCount: 100
  pollingInterval: 10
  cooldownPeriod:  10
  triggers:
  - type: aws-sqs-queue
    metadata:
      queueURL: ${QUEUE_URL}
      activationQueueLength: "0"
      queueLength: "5"
      awsRegion: ${AWS_REGION}
      identityOwner: operator
In a nutshell, ScaledObject is a Custom Resource definition which is used to define how KEDA should scale your application and what the thresholds and metric sources are. The “.spec.ScaleTargetRef” section holds the reference to the target resource, (for example Deployment, StatefulSet, or Custom Resource). The “spec.triggers” section define which metrics will initiate a scale action.
Check Scalers for more details and source options.
What does ScaledObject do?
If you want to use KEDA with an Amazon SQS queue as an event source, the flow of information would be:
- When no messages are pending processing (using “ApproximateNumberOfMessages” from “GetQueueAttributes” AWS API, KEDA can scale the deployment to zero.
- When a message arrives, KEDA detects this event and activates the deployment.
- When the deployment starts running, one of the containers connects to the Amazon SQS queue and starts pulling messages.
- As more messages arrive at the Amazon SQS queue, KEDA can feed this data to the HPA to drive scale out.
- Each replica of the deployment actively processes messages. Likely, each replica is processing a batch of messages in a distributed manner (depending on how many messages each pod can handle).
Scaled Object for Amazon SQS Queue
This section details how to create a scaled object using the number of messages from an Amazon SQS queue to scale a sample application.
Create an SQS Queue to be consumed by your application
- Create an Amazon SQS queue.
export QUEUE_NAME=app-queue

export QUEUE_URL=$(aws sqs create-queue --queue-name=app-queue --region=${AWS_REGION} --output=text --query=QueueUrl)

echo "export QUEUE_NAME=$QUEUE_NAME" >> /home/ec2-user/.bashrc
echo "export QUEUE_URL=$QUEUE_URL" >> /home/ec2-user/.bashrc
- Create an IAM policy to get metrics about the queue. The policy will be attached to keda-operator role, so that KEDA will be able to GetQueueAttributes to check the number of messages and then invoke a scale action.
envsubst < scaledobject-samples/amazonsqs/setup/keda-sqs-policy.json > /tmp/keda-sqs-policy.json && mv /tmp/keda-sqs-policy.json scaledobject-samples/amazonsqs/setup/keda-sqs-policy.json
aws iam create-policy --policy-name sqsgetattributes --policy-document file://scaledobject-samples/amazonsqs/setup/keda-sqs-policy.json
- Attach the new policy to the KEDA Operator role created during the KEDA installation steps.
aws iam attach-role-policy --role-name ${KEDA_OPERATOR_ROLENAME} --policy-arn "arn:aws:iam::${ACCOUNT_ID}:policy/sqsgetattributes"
Build and upload the consumer application to the Amazon ECR registry
In this example, you will deploy your first application with zero replica. That application will consume messages from an Amazon SQS queue. The following steps are curated from the Amazon ECR User Guide.
- Start building your application using docker.
docker build -t sqsconsumer scaledobject-samples/amazonsqs/sample-app/
- Log in to your Amazon ECR registry using the command below.
aws ecr get-login-password --region ${AWS_REGION} | docker login --username AWS --password-stdin ${ACCOUNT_ID}.dkr.ecr.${AWS_REGION}.amazonaws.com
- Create an Amazon ECR repository using the command below.
aws ecr create-repository --repository-name sqsconsumer --image-scanning-configuration scanOnPush=true --region ${AWS_REGION}
- Tag and push the image created in Step 1 to the Amazon ECR repository created in the previous step.
docker tag sqsconsumer:latest ${ACCOUNT_ID}.dkr.ecr.${AWS_REGION}.amazonaws.com/sqsconsumer

docker push ${ACCOUNT_ID}.dkr.ecr.${AWS_REGION}.amazonaws.com/sqsconsumer
Deploy the consumer application to the Amazon EKS cluster
- Create the keda-sqs-guidance namespace.
kubectl create namespace keda-sqs-guidance
- Create an IAM policy to be used by your application to get messages the from Amazon SQS queue you previously created.
envsubst < scaledobject-samples/amazonsqs/setup/sqs-consumer-policy.json > /tmp/sqs-consumer-policy.json && mv /tmp/sqs-consumer-policy.json scaledobject-samples/amazonsqs/setup/sqs-consumer-policy.json
aws iam create-policy --policy-name sqsconsumer --policy-document file://scaledobject-samples/amazonsqs/setup/sqs-consumer-policy.json
- Create an IAM service account that uses the IAM policy created in the previous step. That IAM service account will be attached to our deployment (pods) that will consume our queue. Note the difference between the application service account and the keda-operator service account. The last one is used by the KEDA operator to collect data and metrics to handle the scale decisions.
eksctl create iamserviceaccount --name sqsconsumer --namespace keda-sqs-guidance --cluster ${CLUSTER_NAME} --attach-policy-arn "arn:aws:iam::${ACCOUNT_ID}:policy/sqsconsumer" --role-name sqsconsumerrole --approve
- Deploy the application.
envsubst < scaledobject-samples/amazonsqs/setup/sqs-consumer-deployment.yaml > /tmp/sqs-consumer-deployment.yaml && mv /tmp/sqs-consumer-deployment.yaml scaledobject-samples/amazonsqs/setup/sqs-consumer-deployment.yaml
kubectl apply -f scaledobject-samples/amazonsqs/setup/sqs-consumer-deployment.yaml
Expected result:
deployment.apps/sqs-consumer-backend created
Deploy the ScaledObject
Create a ScaledObject for the Amazon SQS queue created in previous steps. Some of the details that we have specified in below ScaledObject are:
- scaleTargetRef: Target deployment/replicaset name to be scaled.
- minReplicaCount: Minimum amount of replicas for the scaleTarget (in case of any traffic/scaling action). KEDA will not scale in lower than minReplica configuration.
- maxReplicaCount: Maximum amount of replicas the scaleTarget. KEDA will not scale out beyond the maxReplica configuration
- pollingInterval: How frequently Keda should go for metrics (in seconds). In Amazon SQS example it would be the interval that KEDA will do a GetQueueAttributes API call.
- cooldownPeriod: How many seconds KEDA should wait before downscale. For example, after receiving a metric with 0 messages on the queue, KEDA won’t downscale immediately, but will wait for the cooldown period before downscale.
Triggers:
type: The metric source (Scalers) for scale actions. Check the Scalers documentation to each type.
queueURL: Amazon SQS queue URL that KEDA operator will use to make API calls to get attributes.
activationQueueLength: The number of messages that initiates an “Activation” action. For example, if you want KEDA to activate the deployment (increase the replica for at least 1) when there is at least 1 message in the queue, you can set that property to 0.
queueLength: The number of messages that invoke a “Scaling” action, or in other words, the number of messages that a replica or pod can handle by itself. For example, if we set that property to 5, this means that a pod can handle 5 messages, so that KEDA will scale proportionally for each bunch of 5 messages.
identityOwner: This can be set to operator or pod (by default). In the case that you don’t require authentication, you can set to operator and ensure that the KEDA operator can access the correct Amazon SQS API to get attributes. If authentication is required and permission to access the queue is at pod level, that property needs to be set to pod and configured using Pod identity based authentication or Role based authentication.
Run the below commands to create the scaledobject-sqs.yaml file and then deploy to the Amazon EKS cluster.
envsubst < scaledobject-samples/amazonsqs/scaledobject-sqs.yaml > /tmp/scaledobject-sqs.yaml && mv /tmp/scaledobject-sqs.yaml scaledobject-samples/amazonsqs/scaledobject-sqs.yaml
kubectl apply -f scaledobject-samples/amazonsqs/scaledobject-sqs.yaml
The KEDA operator will automatically create an HPA to track the scale from 1 to more pods.
Expected Result:
scaledobject.keda.sh/sqsconsumer-hpa created
Test and scale the application
- Use the below command to watch your pod lifecycle.
kubectl get pods -o wide -n keda-sqs-guidance --watch
- Using another terminal (select green “+” button on the Cloud9 interface), run the below commands to send messages to your queue. If you want to increase the rate of messages, open another terminal window and run the same commands.
source /home/ec2-user/.bashrc

for i in `seq 500`; do aws sqs send-message --queue-url ${QUEUE_URL} --message-body "XXXX" --region ${AWS_REGION} --no-cli-pager --output text; done
- Check in the first terminal that pods will be in the Creating and Running states. If you stop the previous command, pods will change the Terminating state because the HPA created and managed by the KEDA ScaledObject will downscale the deployment.
Expected Result:
NAME                                   READY   STATUS    RESTARTS   AGE   IP                NODE                              NOMINATED NODE   READINESS GATES
sqs-consumer-backend-5c7c4c569f-lc99j   1/1     Running             0          1s    192.168.162.143   ip-192-168-171-225.us-west-2.compute.internal   <none>           <none>
sqs-consumer-backend-5c7c4c569f-ftffd   1/1     Running             0          1s    192.168.163.232   ip-192-168-171-225.us-west-2.compute.internal   <none>           <none>
sqs-consumer-backend-5c7c4c569f-k474d   1/1     Running             0          1s    192.168.152.54    ip-192-168-135-23.us-west-2.compute.internal    <none>           <none>
sqs-consumer-backend-5c7c4c569f-b69lf   1/1     Running             0          1s    192.168.180.5     ip-192-168-171-225.us-west-2.compute.internal   <none>           <none>
sqs-consumer-backend-5c7c4c569f-s4gzz   1/1     Running             0          1s    192.168.147.47    ip-192-168-135-23.us-west-2.compute.internal    <none>           <none>
sqs-consumer-backend-5c7c4c569f-4kktm   1/1     Running             0          1s    192.168.153.107   ip-192-168-135-23.us-west-2.compute.internal    <none>           <none>
sqs-consumer-backend-5c7c4c569f-4c969   1/1     Running             0          2s    192.168.161.83    ip-192-168-171-225.us-west-2.compute.internal   <none>           <none>
sqs-consumer-backend-5c7c4c569f-b69lf   1/1     Terminating         0          82s   192.168.180.5     ip-192-168-171-225.us-west-2.compute.internal   <none>           <none>
sqs-consumer-backend-5c7c4c569f-k474d   1/1     Terminating         0          97s   192.168.152.54    ip-192-168-135-23.us-west-2.compute.internal    <none>           <none>
sqs-consumer-backend-5c7c4c569f-4kktm   1/1     Terminating         0          82s     192.168.153.107   ip-192-168-135-23.us-west-2.compute.internal    <none>           <none>
sqs-consumer-backend-5c7c4c569f-ftffd   1/1     Terminating         0          97s     192.168.163.232   ip-192-168-171-225.us-west-2.compute.internal   <none>           <none>
sqs-consumer-backend-5c7c4c569f- lc99j   1/1     Terminating         0          97s     192.168.162.143   ip-192-168-171-225.us-west-2.compute.internal   <none>           <none>
- Check the logs of KEDA. You will notice scaling actions and the Activation action.
kubectl -n keda logs -l app.kubernetes.io/name=keda-operator
Expected Result:
2023-12-26T17:03:41Z    INFO    scaleexecutor   Successfully updated ScaleTarget {"scaledobject.Name": "sqsconsumer-hpa", "scaledObject.Namespace": "keda-sqs-guidance", "scaleTarget.Name": "sqs-consumer-backend", "Original Replicas Count": 0, "New Replicas Count": 4}
2023-12-26T17:03:45Z    INFO    Reconciling ScaledObject  {"controller": "scaledobject", "controllerGroup": "keda.sh", "controllerKind": "ScaledObject", "ScaledObject": {"name":"sqsconsumer-hpa","namespace":"keda-sqs-guidance"}, "namespace": "keda-sqs-guidance", "name": "sqsconsumer-hpa", "reconcileID": "a27400eb-ea17-43ca-bdb1-97ba2abd8b33"}
2023-12-26T17:05:51Z    INFO    scaleexecutor   Successfully set ScaleTarget replicas count to ScaledObject minReplicaCount     {"scaledobject.Name": "sqsconsumer-hpa", "scaledObject.Namespace": "keda-sqs-guidance", "scaleTarget.Name": "sqs-consumer-backend", "Original Replicas Count": 4, "New Replicas Count": 0}
- You can also check the HPA scaling events:
kubectl describe hpa keda-hpa-sqsconsumer-hpa -n keda-sqs-guidance
Clean up the Amazon SQS environment
- Delete the consumer application (deployment) and KEDA Scaled Object.
kubectl delete deployment sqs-consumer-backend -n keda-sqs-guidance

kubectl delete scaledObject sqsconsumer-hpa -n keda-sqs-guidance

aws ecr delete-repository --repository-name sqsconsumer --registry-id ${ACCOUNT_ID} --force
- Following the least privilege principle, delete the IAM Role for Service account used by the consumer application to consume the Amazon SQS queue.
eksctl delete iamserviceaccount --cluster ${CLUSTER_NAME} --name sqsconsumer --namespace keda-sqs-guidance
Expected output:
2023-11-03 12:12:23 [ℹ]  1 iamserviceaccount (keda-guidance/sqsconsumer) was included (based on the include/exclude rules)
2023-11-03 12:12:24 [ℹ]  1 task: {
    2 sequential sub-tasks: {
        delete IAM role for serviceaccount "keda-guidance/sqsconsumer" [async],
        delete serviceaccount "keda-guidance/sqsconsumer",
    } }2023-11-03 12:12:24 [ℹ]  will delete stack "eksctl-eks-keda-guidance-addon-iamserviceaccount-keda-guidance-sqsconsumer"
2023-11-03 12:12:24 [ℹ]  deleted serviceaccount "keda-guidance/sqsconsumer"
- Delete the IAM policy used with the sqsconsumer role.
aws iam delete-policy --policy-arn "arn:aws:iam::${ACCOUNT_ID}:policy/sqsconsumer"
- Detach from the keda-operator role and delete the IAM policy used by KEDA to consume GetAttributes API from SQS Queue.
aws iam detach-role-policy --role-name ${KEDA_OPERATOR_ROLENAME} --policy-arn "arn:aws:iam::${ACCOUNT_ID}:policy/sqsgetattributes"

aws iam delete-policy --policy-arn "arn:aws:iam::${ACCOUNT_ID}:policy/sqsgetattributes"
- Delete the Kubernetes namespace.
kubectl delete ns/keda-sqs-guidance
- Delete the Amazon SQS queue.
aws sqs delete-queue --queue-url $QUEUE_URL
Scaled Object for Prometheus Custom Metrics
One of the options to scale your application is custom metrics using the Prometheus scaler. In this Guidance, you will use Amazon Managed Service for Prometheus. This section details how to create a workspace on Amazon Managed Service for Prometheus to store and query custom metrics from the sample application.
Create Amazon Managed Service for Prometheus
Amazon Managed Service for Prometheus is a Prometheus-compatible service that monitors and provides alerts on containerized applications and infrastructure at scale. The service is integrated with Amazon EKS, Amazon Elastic Container Service (ECS), and AWS Distro for OpenTelemetry.
Optionally, you can also set up Amazon Managed Grafana, a fully managed service for Grafana. Grafana is a popular open-source analytics platform that enables you to query, visualize, and alert on your metrics, logs, and traces from sources like Prometheus.
For this Guidance, you can follow the steps to provision a sample workspace with the provided CloudFormation. You can also use the steps outlined in the Prometheus and Grafana documentation to create a workspace.
chmod +x scaledobject-samples/prometheus/setup/create_requirements.sh

./scaledobject-samples/prometheus/setup/create_requirements.sh

source /home/ec2-user/.bashrc
As a requirement, you must also provide the KEDA Operator role with permission to query the Amazon Managed Service for Prometheus.
envsubst < scaledobject-samples/prometheus/setup/keda-prometheus-policy.json > /tmp/keda-prometheus-policy.json && mv /tmp/keda-prometheus-policy.json scaledobject-samples/prometheus/setup/keda-prometheus-policy.json
aws iam create-policy --policy-name queryamp --policy-document file://scaledobject-samples/prometheus/setup/keda-prometheus-policy.json
aws iam attach-role-policy --role-name ${KEDA_OPERATOR_ROLENAME} --policy-arn "arn:aws:iam::${ACCOUNT_ID}:policy/queryamp"
Deploy sample application
This section details how to deploy a sample application that generates custom metrics that will be stored in Prometheus and used by KEDA to scale the application. This application is a simple python code using flask and prometheus-client to expose the amount of requests the application is serving.
# Build and Push Container Image
aws ecr get-login-password \
     --region $AWS_REGION | docker login \
     --username AWS \
     --password-stdin $SAMPLE_APP_ECR

docker build -t $SAMPLE_APP_ECR scaledobject-samples/prometheus/sample-app/

docker push $SAMPLE_APP_ECR

# Create K8s Deployment with Sample App
sed -i "s|{SAMPLE_APP_ECR}|$SAMPLE_APP_ECR|g" ./scaledobject-samples/prometheus/sample-app/app.yaml

kubectl apply -f scaledobject-samples/prometheus/sample-app/app.yaml

# Check the resources
kubectl get all -n keda-prometheus-guidance
Scraping metrics using AWS Distro for Open Telemetry
AWS Distro for OpenTelemetry is a secure, production-ready, AWS-supported distribution of the OpenTelemetry project. Part of the Cloud Native Computing Foundation, OpenTelemetry provides open-source APIs, libraries, and agents to collect distributed traces and metrics for application monitoring. With AWS Distro for OpenTelemetry, you can instrument your applications just once to send correlated metrics and traces to multiple AWS and Partner monitoring solutions.
- First, create a ConfigMap with the AWS Distro for Open Telemetry collector configuration composed of receiver, processors, and exporters. For more details about Open Telemetry collector configuration, visit this dococumentation.
sed -i "s|{PROMETHEUS_ENDPOINT}|$PROMETHEUS_ENDPOINT|g" ./scaledobject-samples/prometheus/adot/configmap.yaml

sed -i "s|{AWS_REGION}|$AWS_REGION|g" ./scaledobject-samples/prometheus/adot/configmap.yaml
kubectl apply -f ./scaledobject-samples/prometheus/adot/configmap.yaml
- Now that you have the configuration, deploy the AWS Distro for Open Telemetry collector:
eksctl create iamserviceaccount --name adot-collector --namespace adot --cluster $CLUSTER_NAME --attach-policy-arn arn:aws:iam::aws:policy/AmazonPrometheusRemoteWriteAccess --approve
sed -i "s|{AWS_REGION}|$AWS_REGION|g" ./scaledobject-samples/prometheus/adot/collector.yaml
kubectl apply -f ./scaledobject-samples/prometheus/adot/collector.yaml

# Check the resources
kubectl get all -n adot
Set up SigV4 Proxy for KEDA to query Prometheus metrics
AWS Signature Version 4 is a process to add authentication information to requests made to AWS APIs using HTTP. The AWS Command Line Interface (AWS CLI) and AWS SDKs already use this protocol to make calls to the AWS APIs. Amazon Managed Service for Prometheus requires the API calls to have sigv4 authentication, and since KEDA doesn’t support sigv4, you will deploy a sigv4 proxy service to act as a gateway for KEDA to access the query endpoint of the Amazon Managed Service for Prometheus. Run the following commands to deploy the sig-v4 proxy:
sed -i "s|{AWS_REGION}|$AWS_REGION|g" ./scaledobject-samples/prometheus/sigv4/keda-sigv4.yaml

kubectl apply -f ./scaledobject-samples/prometheus/sigv4/keda-sigv4.yaml
Set up a Scaled Object for Query Prometheus metrics
This section details how to configure the ScaledObject custom resource definition for your sample app.
cat << EOF > scaledobject.yaml
---
apiVersion: keda.sh/v1alpha1
kind: ScaledObject
metadata:
  name: app-http-requests-minute
  namespace: keda-prometheus-guidance
spec:
  scaleTargetRef:
    apiVersion: apps/v1
    kind: Deployment
    name: sample-app
  pollingInterval:  10
  cooldownPeriod:   10
  minReplicaCount: 1        # Optional. Default: 0
  maxReplicaCount: 20       # Optional. Default: 100
  triggers:
    - type: prometheus
      metadata:
        serverAddress: http://keda-sigv4.keda.svc.cluster.local/workspaces/$PROMETHEUS_WORKSPACE
        metricName: http_requests_minute
        awsRegion: "$AWS_REGION"
        identityOwner: operator
        threshold: '10'
        # Note: query must return a vector/scalar single element response
        query: sum(rate(adot_app_request_count_total[1m]))
---
EOF

kubectl apply -f scaledobject.yaml
Test and scale the application
Use the command below to watch your pod lifecycle.
kubectl get pods -o wide -n keda-prometheus-guidance --watch
Generate traffic by running the following command in a separate terminal session (select green “+” button on Cloud9 interface), and run the below commands to send requests to the application.
# Get Load Balancer URL
SAMPLEAPP_INGRESS_URL=$(kubectl get svc prometheus-sampleapp-svc -n keda-prometheus-guidance -o jsonpath='{.status.loadBalancer.ingress[*].hostname}')

# Run Curl Requests
for i in `seq 99999`; do curl http://$SAMPLEAPP_INGRESS_URL; done
Check in the first terminal that pods will be in the Creating and Running states. If you stop the previous command, the pods will change Terminating state because the HPA created and managed by KEDA ScaledObject will downscale the deployment.
The scale down will take longer to complete compared to the Amazon SQS example. This happens when you use a minReplicaCount larger than 0, and the Kubernetes HPA cooldown (defaults to 5 min) takes effect on those scenarios. Review more details at the GitHub issue: cooldownPeriod parameter not working as expected.
NAME                          READY   STATUS    RESTARTS   AGE   IP               NODE                                           NOMINATED NODE   READINESS GATES
sample-app-7d469647b7-nqnxl   1/1     Running   0          18s   192.168.159.61   ip-192-168-135-23.us-west-2.compute.internal   <none>           <none>
sample-app-7d469647b7-jwssz   0/1     Pending   0          0s    <none>           <none>                                         <none>           <none>
sample-app-7d469647b7-jwssz   0/1     Pending   0          0s    <none>           ip-192-168-171-225.us-west-2.compute.internal   <none>           <none>
sample-app-7d469647b7-28clf   0/1     Pending   0          0s    <none>           <none>                                          <none>           <none>
sample-app-7d469647b7-28clf   0/1     Pending   0          0s    <none>           ip-192-168-135-23.us-west-2.compute.internal    <none>           <none>
sample-app-7d469647b7-jwssz   0/1     ContainerCreating   0          0s    <none>           ip-192-168-171-225.us-west-2.compute.internal   <none>           <none>
sample-app-7d469647b7-28clf   0/1     ContainerCreating   0          0s    <none>           ip-192-168-135-23.us-west-2.compute.internal    <none>           <none>
sample-app-7d469647b7-28clf   1/1     Running             0          1s    192.168.153.107   ip-192-168-135-23.us-west-2.compute.internal    <none>           <none>
sample-app-7d469647b7-jwssz   1/1     Running             0          2s    192.168.180.5     ip-192-168-171-225.us-west-2.compute.internal   <none>           <none>
sample-app-7d469647b7-fqg2m   0/1     Pending             0          0s    <none>            <none>                                          <none>           <none>
sample-app-7d469647b7-fqg2m   0/1     Pending             0          0s    <none>            ip-192-168-171-225.us-west-2.compute.internal   <none>           <none>
sample-app-7d469647b7-fqg2m   0/1     ContainerCreating   0          0s    <none>            ip-192-168-171-225.us-west-2.compute.internal   <none>           <none>
sample-app-7d469647b7-fqg2m   1/1     Running             0          2s    192.168.172.108   ip-192-168-171-225.us-west-2.compute.internal   <none>           <none>
sample-app-7d469647b7-5nrck   0/1     Pending             0          0s    <none>            <none>                                          <none>           <none>
sample-app-7d469647b7-5nrck   0/1     Pending             0          0s    <none>            ip-192-168-135-23.us-west-2.compute.internal    <none>           <none>
sample-app-7d469647b7-5nrck   0/1     ContainerCreating   0          0s    <none>            ip-192-168-135-23.us-west-2.compute.internal    <none>           <none>
sample-app-7d469647b7-5nrck   1/1     Running             0          1s    192.168.152.54    ip-192-168-135-23.us-west-2.compute.internal    <none>           <none>
sample-app-7d469647b7-nqnxl   1/1     Terminating         0          6m15s   192.168.159.61    ip-192-168-135-23.us-west-2.compute.internal    <none>           <none>
sample-app-7d469647b7-28clf   1/1     Terminating         0          5m32s   192.168.153.107   ip-192-168-135-23.us-west-2.compute.internal    <none>           <none>
sample-app-7d469647b7-jwssz   1/1     Terminating         0          5m47s   192.168.180.5     ip-192-168-171-225.us-west-2.compute.internal   <none>           <none>
sample-app-7d469647b7-fqg2m   1/1     Terminating         0          5m47s   192.168.172.108   ip-192-168-171-225.us-west-2.compute.internal   <none>           <none>
sample-app-7d469647b7-28clf   0/1     Terminating         0          6m2s    <none>            ip-192-168-135-23.us-west-2.compute.internal    <none>           <none>
sample-app-7d469647b7-nqnxl   0/1     Terminating         0          6m45s   <none>            ip-192-168-135-23.us-west-2.compute.internal    <none>           <none>
sample-app-7d469647b7-28clf   0/1     Terminating         0          6m3s    192.168.153.107   ip-192-168-135-23.us-west-2.compute.internal    <none>           <none>
sample-app-7d469647b7-nqnxl   0/1     Terminating         0          6m46s   192.168.159.61    ip-192-168-135-23.us-west-2.compute.internal    <none>           <none>
sample-app-7d469647b7-nqnxl   0/1     Terminating         0          6m46s   192.168.159.61    ip-192-168-135-23.us-west-2.compute.internal    <none>           <none>
sample-app-7d469647b7-nqnxl   0/1     Terminating         0          6m46s   192.168.159.61    ip-192-168-135-23.us-west-2.compute.internal    <none>           <none>
sample-app-7d469647b7-28clf   0/1     Terminating         0          6m3s    192.168.153.107   ip-192-168-135-23.us-west-2.compute.internal
<none>           <none>
Check the HPA scaling events:
kubectl describe hpa -n keda-prometheus-guidance
Expected output:
Events:
Type    Reason             Age                From                       Message
  ----    ------             ----               ----                       -------
  Normal  SuccessfulRescale  20m                horizontal-pod-autoscaler  New size: 6; reason: external metric s0-prometheus(&LabelSelector{MatchLabels:map[string]string{scaledobject.keda.sh/name: app-http-requests-minute,},MatchExpressions:[]LabelSelectorRequirement{},}) above target
  Normal  SuccessfulRescale  12m                horizontal-pod-autoscaler  New size: 4; reason: All metrics below target
  Normal  SuccessfulRescale  10m (x2 over 20m)  horizontal-pod-autoscaler  New size: 3; reason: external metric s0-prometheus(&LabelSelector{MatchLabels:map[string]string{scaledobject.keda.sh/name: app-http-requests-minute,},MatchExpressions:[]LabelSelectorRequirement{},}) above target
  Normal  SuccessfulRescale  10m (x2 over 20m)  horizontal-pod-autoscaler  New size: 4; reason: external metric s0-prometheus(&LabelSelector{MatchLabels:map[string]string{scaledobject.keda.sh/name: app-http-requests-minute,},MatchExpressions:[]LabelSelectorRequirement{},}) above target
  Normal  SuccessfulRescale  9m49s              horizontal-pod-autoscaler  New size: 5; reason: external metric s0-prometheus(&LabelSelector{MatchLabels:map[string]string{scaledobject.keda.sh/name: app-http-requests-minute,},MatchExpressions:[]LabelSelectorRequirement{},}) above target
  Normal  SuccessfulRescale  4m47s              horizontal-pod-autoscaler  New size: 3; reason: All metrics below target
  Normal  SuccessfulRescale  4m32s              horizontal-pod-autoscaler  New size: 2; reason: All metrics below target
  Normal  SuccessfulRescale  4m17s              horizontal-pod-autoscaler  New size: 1; reason: All metrics below target
Clean up Prometheus environment
Delete the Kubernetes resources created for the sample application.
kubectl delete -f scaledobject-samples/prometheus/sample-app/app.yaml
Additionally, delete the AWS Distro for Open Telemetry, Sigv4, and the IAM Role for Service Account used by AWS Distro for Open Telemetry.
eksctl delete iamserviceaccount --cluster ${CLUSTER_NAME} --name adot-collector --namespace adot

kubectl delete -f scaledobject-samples/prometheus/adot/collector.yaml

kubectl delete -f scaledobject-samples/prometheus/adot/configmap.yaml

kubectl delete -f scaledobject-samples/prometheus/sigv4/keda-sigv4.yaml
Detach from keda-operator role and delete the IAM policy used by KEDA to consume QueryMetrics from Amazon Managed Service for Prometheus.
aws iam detach-role-policy --role-name ${KEDA_OPERATOR_ROLENAME} --policy-arn "arn:aws:iam::${ACCOUNT_ID}:policy/queryamp"

aws iam delete-policy --policy-arn "arn:aws:iam::${ACCOUNT_ID}:policy/queryamp"
Delete the AMP cluster and the Amazon ECR repository created for the sample application.
aws cloudformation delete-stack --stack-name keda-guidance --region $AWS_REGION --output json
Clean up KEDA and the Amazon EKS Cluster Environment
- Uninstall KEDA using helm.
helm uninstall keda --namespace ${KEDA_NAMESPACE}
- Following least privilege principle, delete the IAM role used by KEDA.
aws iam delete-role --role-name ${KEDA_OPERATOR_ROLENAME}
- Delete the KEDA namespace.
kubectl delete namespace ${KEDA_NAMESPACE}
- Delete the Amazon EKS cluster using the eksctl command below.
eksctl delete cluster --name ${CLUSTER_NAME}
Clean up the Cloud9 environment
Delete the Cloud9 environment by selecting the environment and selecting Delete, as shown in Figure 11.
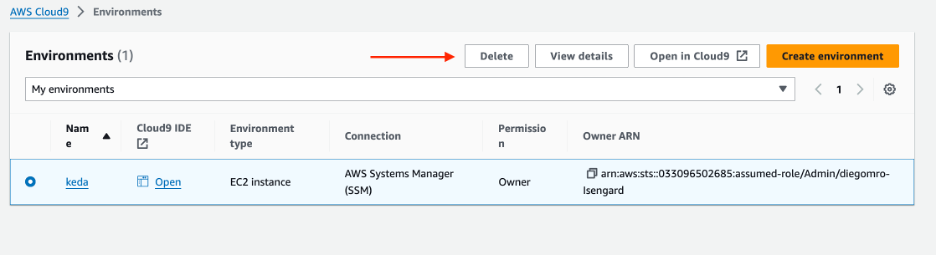
Figure 11: Select the environment you want to delete, then choose Delete.
If you have deployed the AWS Cloud9 instance using CloudFormation template, you can delete the stack selecting Delete, as shown in Figure 12.
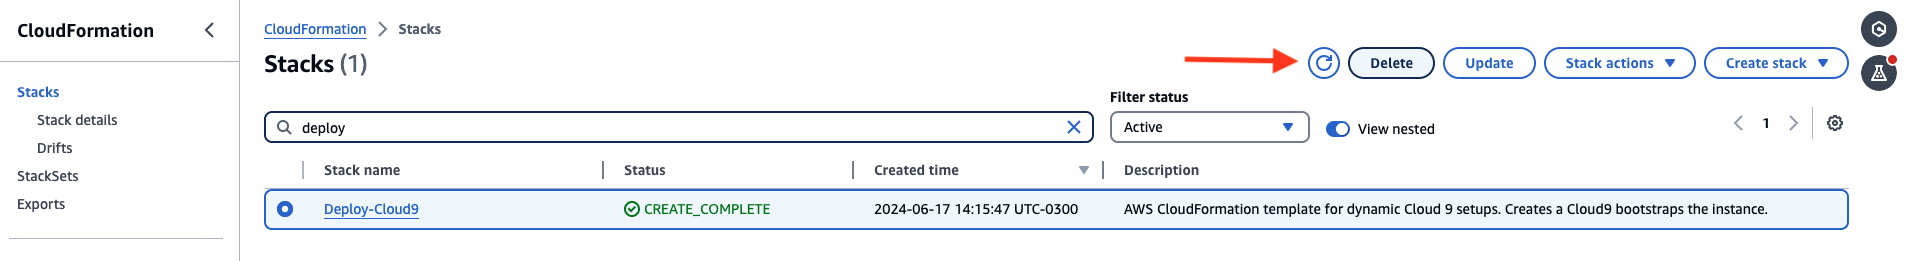
Figure 12: Select the stack you want to delete, then choose Delete.
Support and Troubleshooting
Guidance for Event-Driven Application Autoscaling with KEDA on Amazon EKS is maintained by AWS Solution Architects. It is not part of an AWS service, and support is provided best-effort by the Guidance community.
To post feedback, submit feature ideas or report bugs, use the Issues section of the project GitHub repository (and the survey feedback link on the Guidance webpage).
Version Requirements
This version of Guidance requires the following version of core tools:
Contributors
- Joao Melo
- Pedro Henrique Oliveira
- Tiago Reichert
- Diego Rocha
- Sreedevi Velagala
Notices
Customers are responsible for making their own independent assessment of the information in this document. This document: (a) is for informational purposes only, (b) represents AWS current product offerings and practices, which are subject to change without notice, and (c) does not create any commitments or assurances from AWS and its affiliates, suppliers or licensors. AWS products or services are provided “as is” without warranties, representations, or conditions of any kind, whether express or implied. AWS responsibilities and liabilities to its customers are controlled by AWS agreements, and this document is not part of, nor does it modify, any agreement between AWS and its customers.