Guidance for Using Google Tag Manager for Server Side Website Analytics on AWS
Solution Overview
The implementation guide illustrates two different approaches to collect and analyze hit-level data using AWS services:
Historical data analysis and visualization using a data lake architecture with Amazon Kinesis Data Streams, Amazon Kinesis Data Firehose, Amazon Simple Storage Service (Amazon S3), Amazon Athena, and Amazon QuickSight.
Near real-time analysis and visualization using Kinesis Data Streams, AWS Lambda, and Amazon OpenSearch Service.
Architecture Overview
This architecture is made up of three main components:
The Google Tag Manager Server-Side Container running on Amazon ECS.
The data collection architecture using Amazon API Gateway, Kinesis Data Streams, and Amazon S3.
The data analysis architecture using:
a. Athena, AWS Glue, and Amazon QuickSight, and
b. OpenSearch Service and OpenSearch Dashboards for near real-time data analysis.
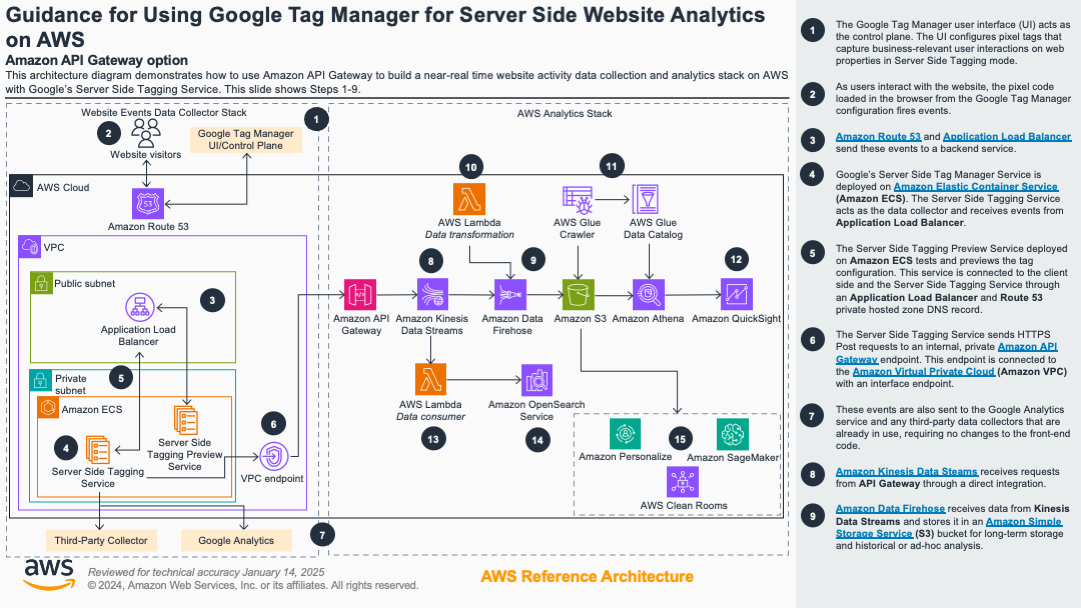
Figure 1. Reference Architecture to build a website analytics platform with Google Tag Manager on AWS.
Prerequisites
Accounts
To get started with this Guidance, you will need access to your Google Analytics™ service and Google Tag Manager accounts. It is not necessary to create a new Google account or Google Analytics™ service web property from scratch if one already exists. However, this Guidance will walk through the steps as if you are doing a greenfield deployment.
Additionally, you will need access to an AWS account with the ability to create and manage the services referenced in this implementation guide.
DNS Names
You will also need to decide on three Domain Name System (DNS) names for the following:
CNAME for the Primary Server-Side Container (for example, analytics.example.com)
CNAME for the Preview Server Container (for example, preview-analytics.example.com)
Optionally a CNAME for a test website (for example, test-analytics.example.com)
These entries don’t need to be set until later in the process, but it’s helpful to decide what they will be ahead of time. Verify that you have access to update your DNS settings.
SSL Certificates
Once you have decided on the domain names above, you will need to issue an SSL Certificate with each of the names listed in the previous section as ALT names. The easiest way to do this is with AWS Certificate Manager.
- In the AWS Certificate Manager console, select the “Request” button to create a new certificate.
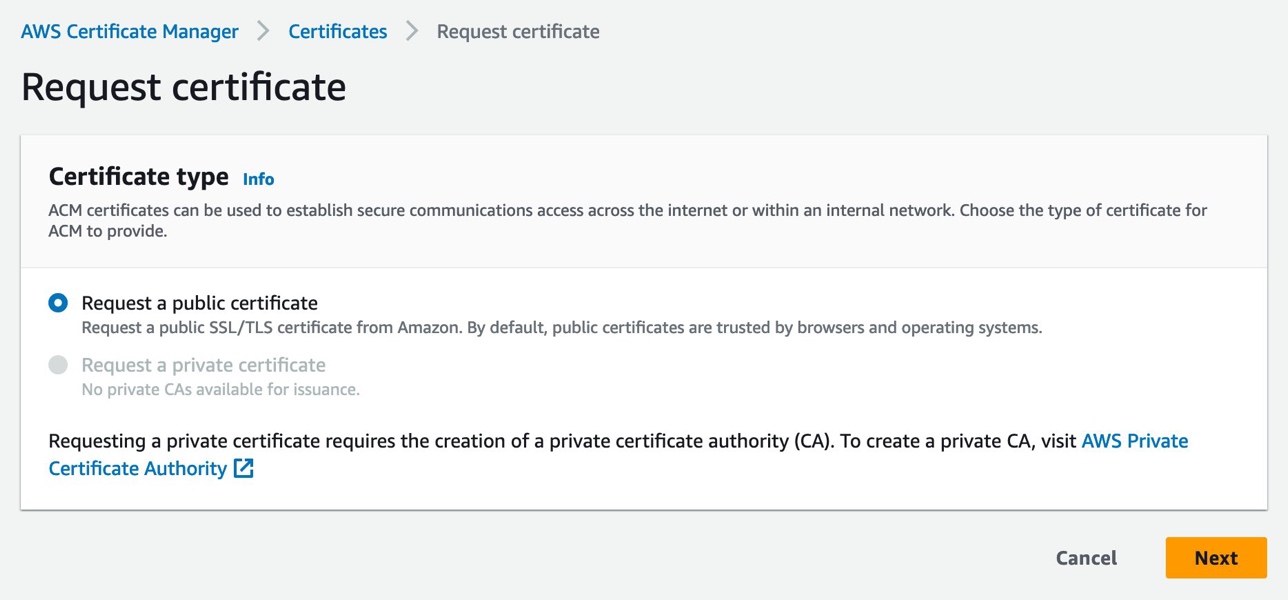
Figure 2. Screenshot of Request Certificate webpage
Complete the following steps in the Domain names section of this dialog:
Enter the domains you have chosen.
Choose your validation method:
Use “DNS validation” if you have direct access to your DNS records. This allows you to enter additional records and validate that you are the owner of this domain.
You can also choose Email validation, which will send a validation email to the email address on file at your DNS provider.
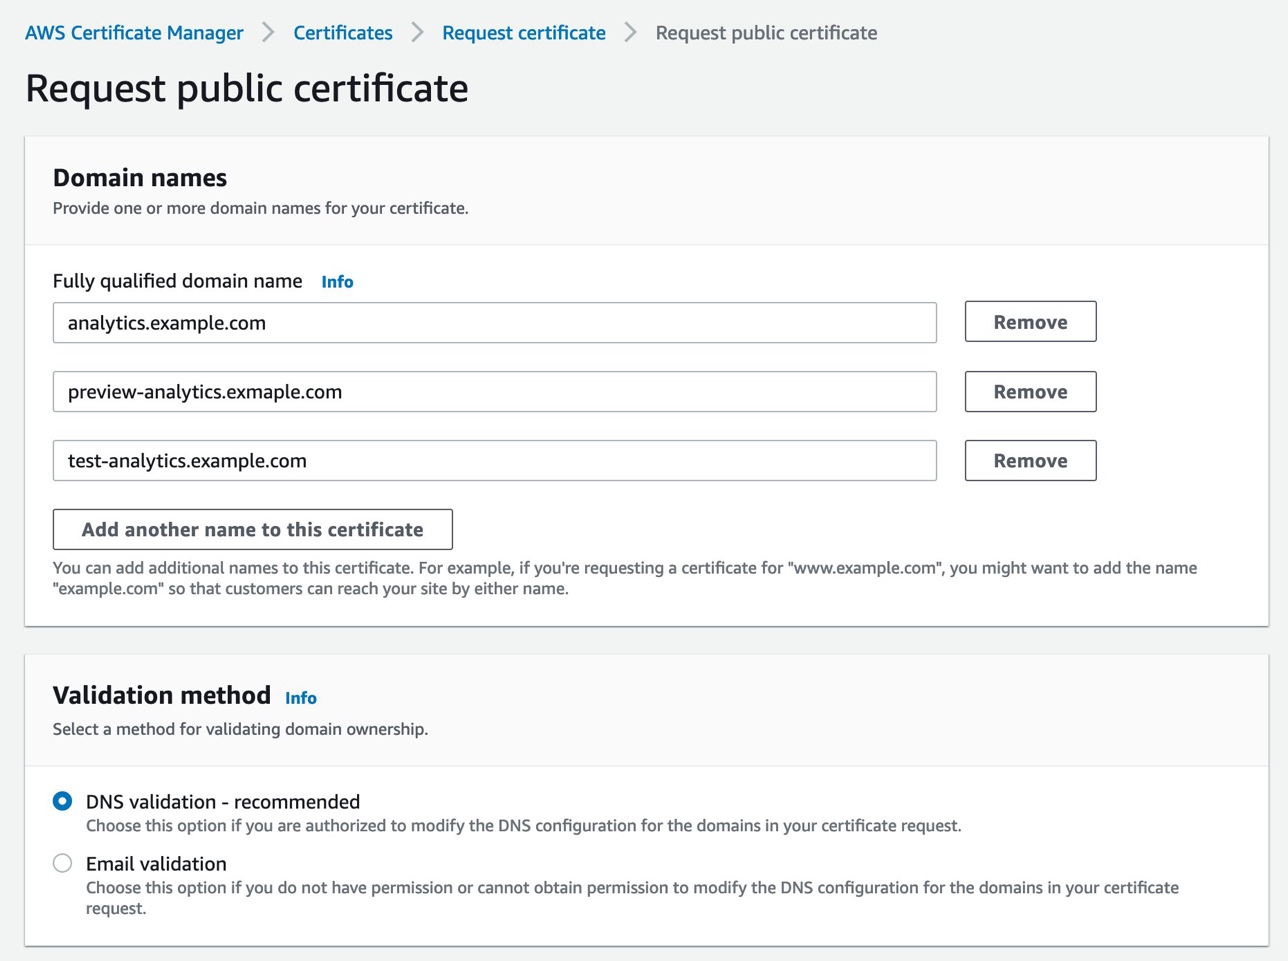
Figure 3. Screenshot of domain naming and validation method.
Google Tag Manager Setup
Google Analytics Setup
Follow the steps below to create a new Google Analytics web property if you don’t already have one.
Navigate to Google Analytics™ service.
a. Select the gear icon on the bottom left of the interface to load the Admin menu.
b. Select Create Property.
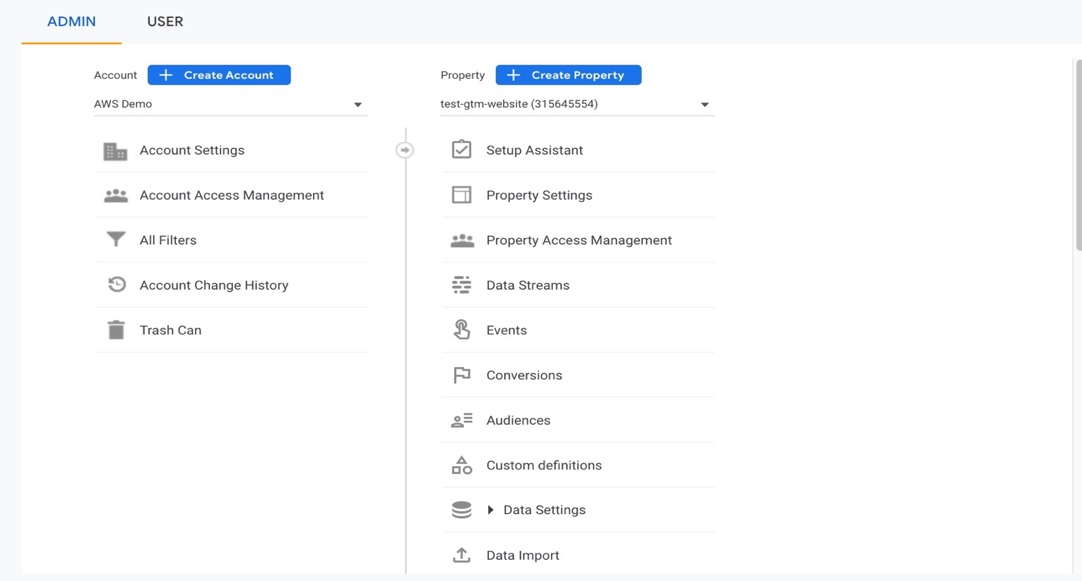
Figure 4. Screenshot of the Create Property function under Admin.
- In the Create property dialog, enter a name for your website and set the correct time zone.
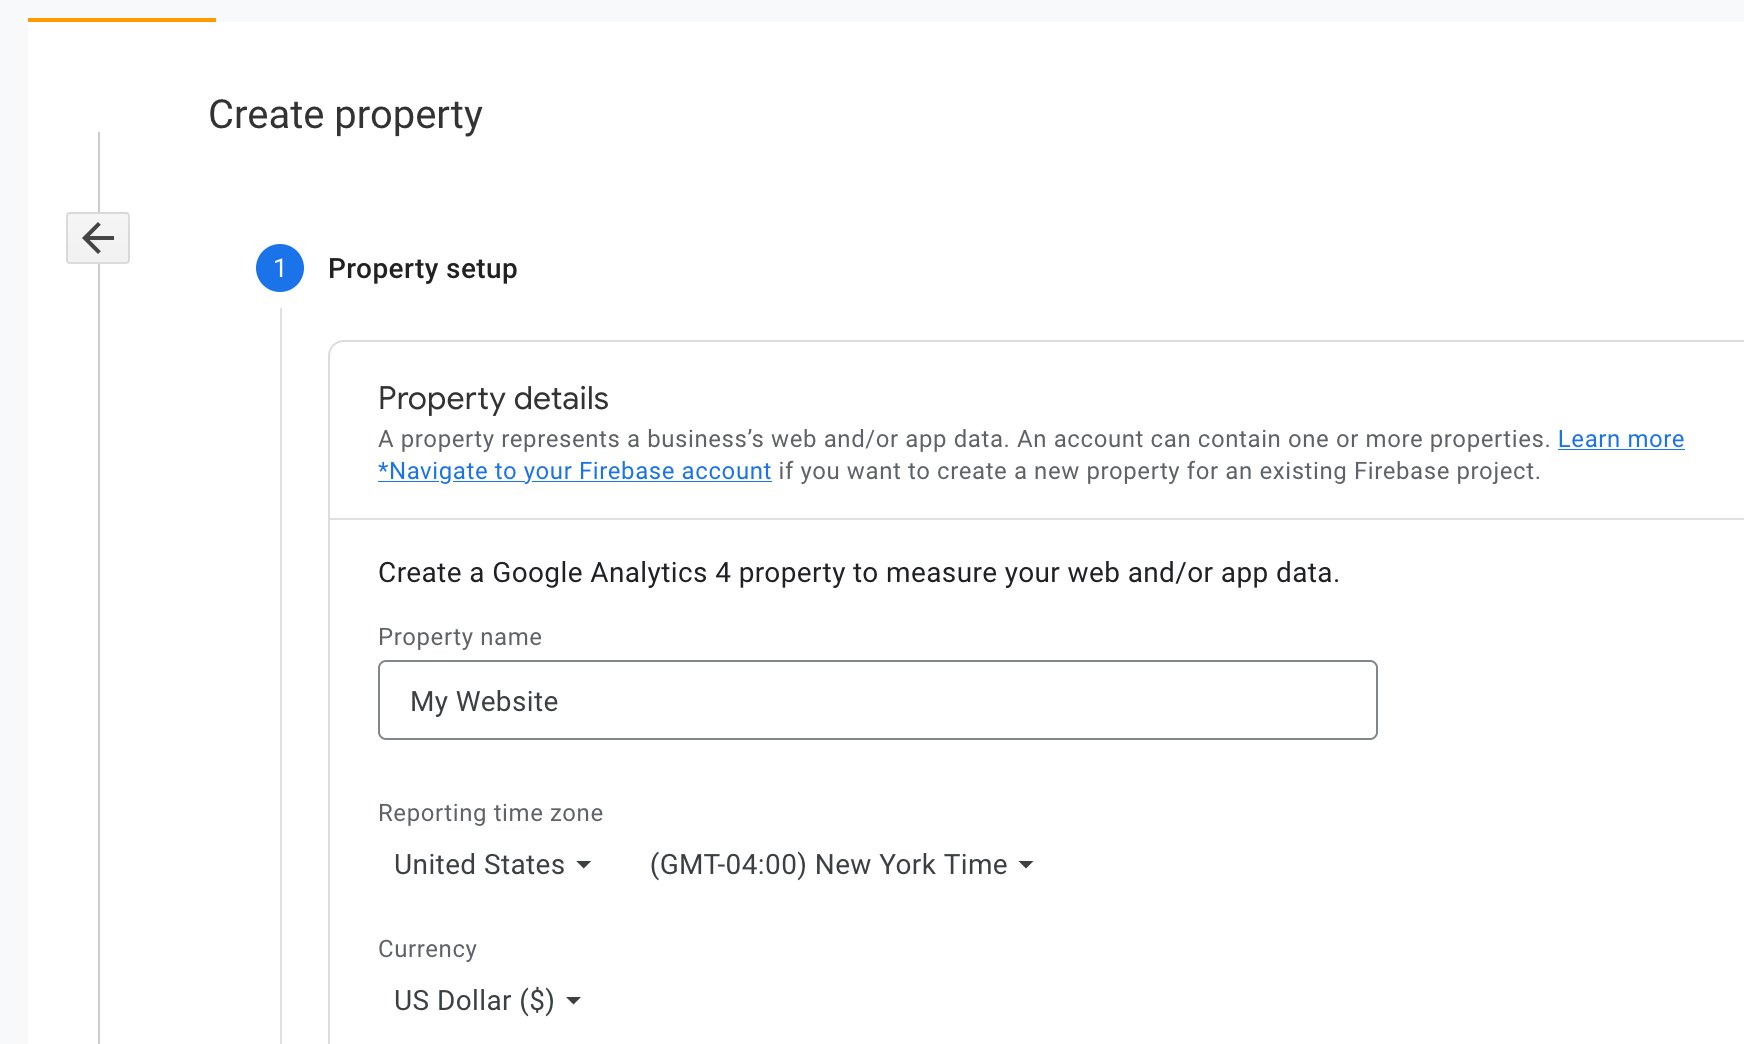
Figure 5. Screenshot of Property setup details.
- Once created, select the Web option to create a new Web Stream.
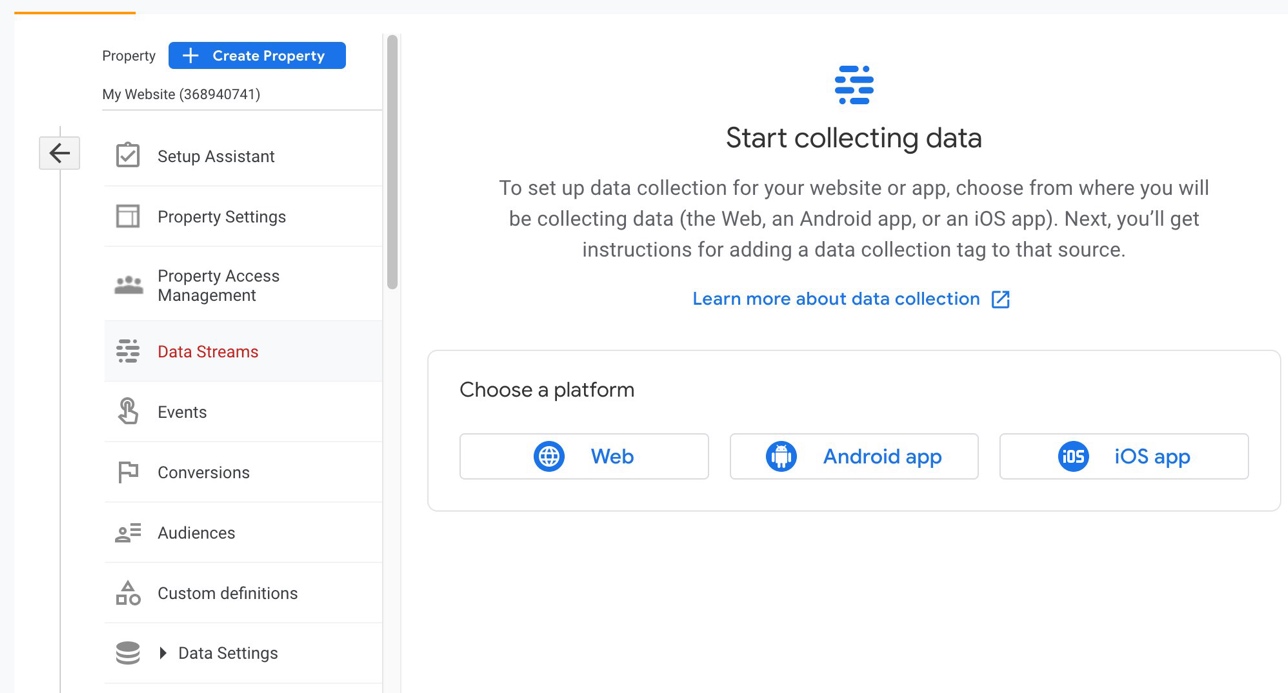
Figure 6. Screenshot showing where to select the Web platform.
- In the Set up a data stream dialog, add your website URL and Stream name. Make sure Enhanced measurement is selected. Once you create the data stream, you will be given a “Measurement ID.” Make note of this ID for Step 5.
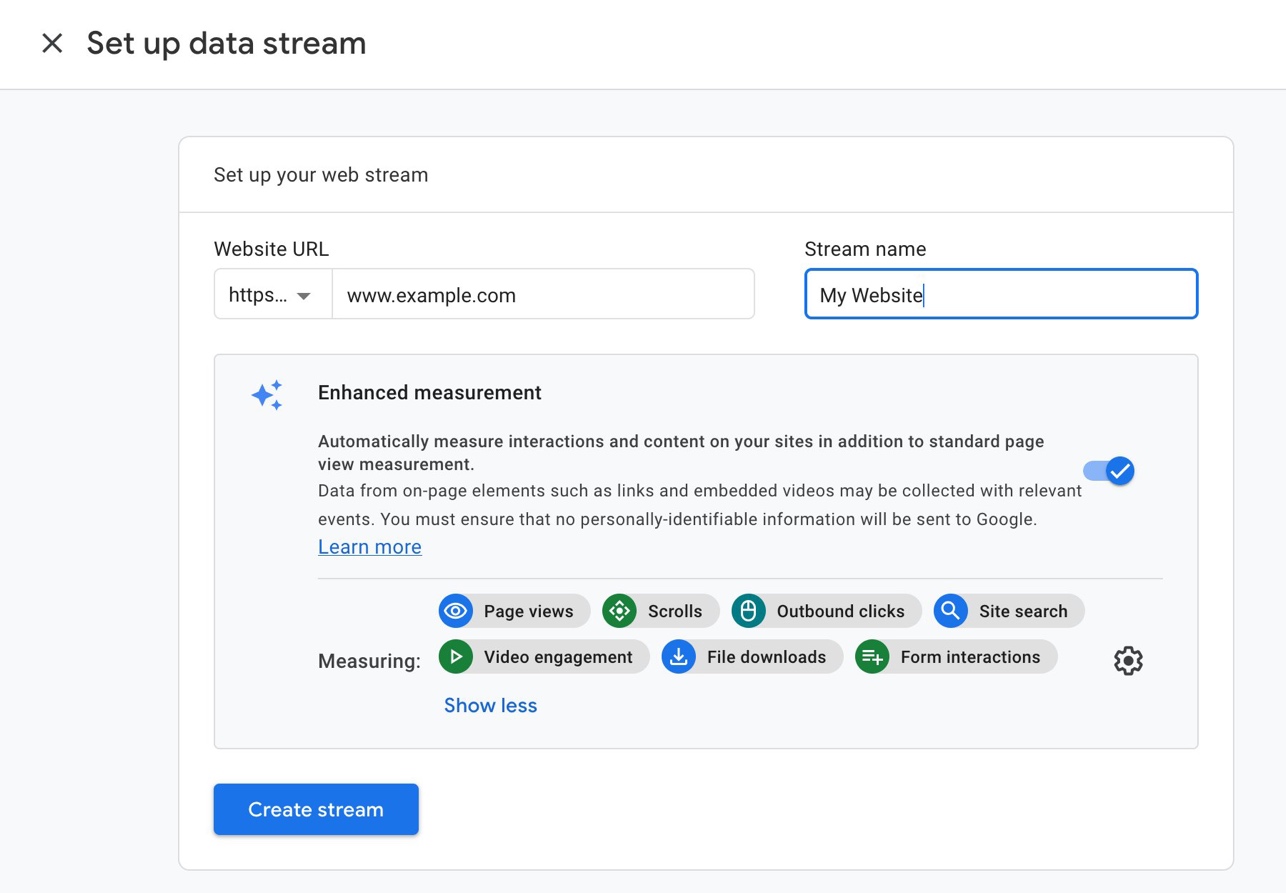
Figure 7. Screenshot showing how to set up your data stream.
- You can find the Measurement ID at any time in the Data Streams settings tab. Just click the name of your Stream to bring up the dialog that displays your Measurement ID.
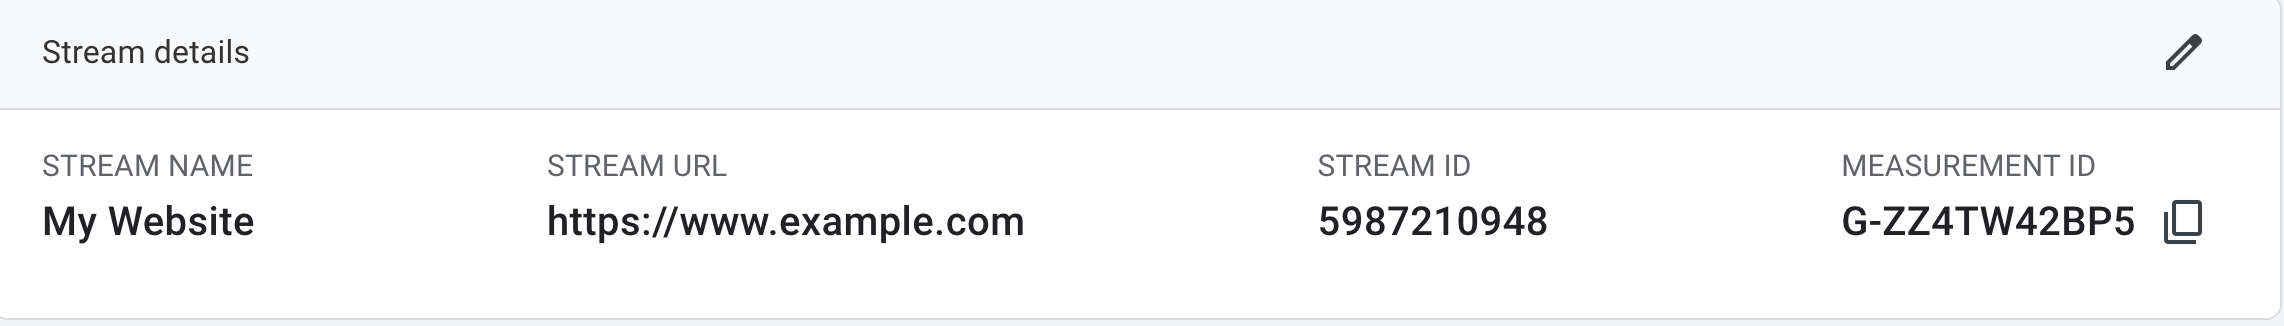
Figure 8. Screenshot of the Measurement ID and other Stream details.
Google Tag Manager Setup
Next, you will set up Google Tag Manager using the following steps:
If you don’t already have a Google Tag Manager account, visit Google Tag Manager and create one.
From the Accounts page, create a new Server Container.
Throughout this implementation guide, you will notice use of the word “container”. This is the term Google uses to describe entities within Google Tag Manager and should not be confused with docker containers running on AWS.
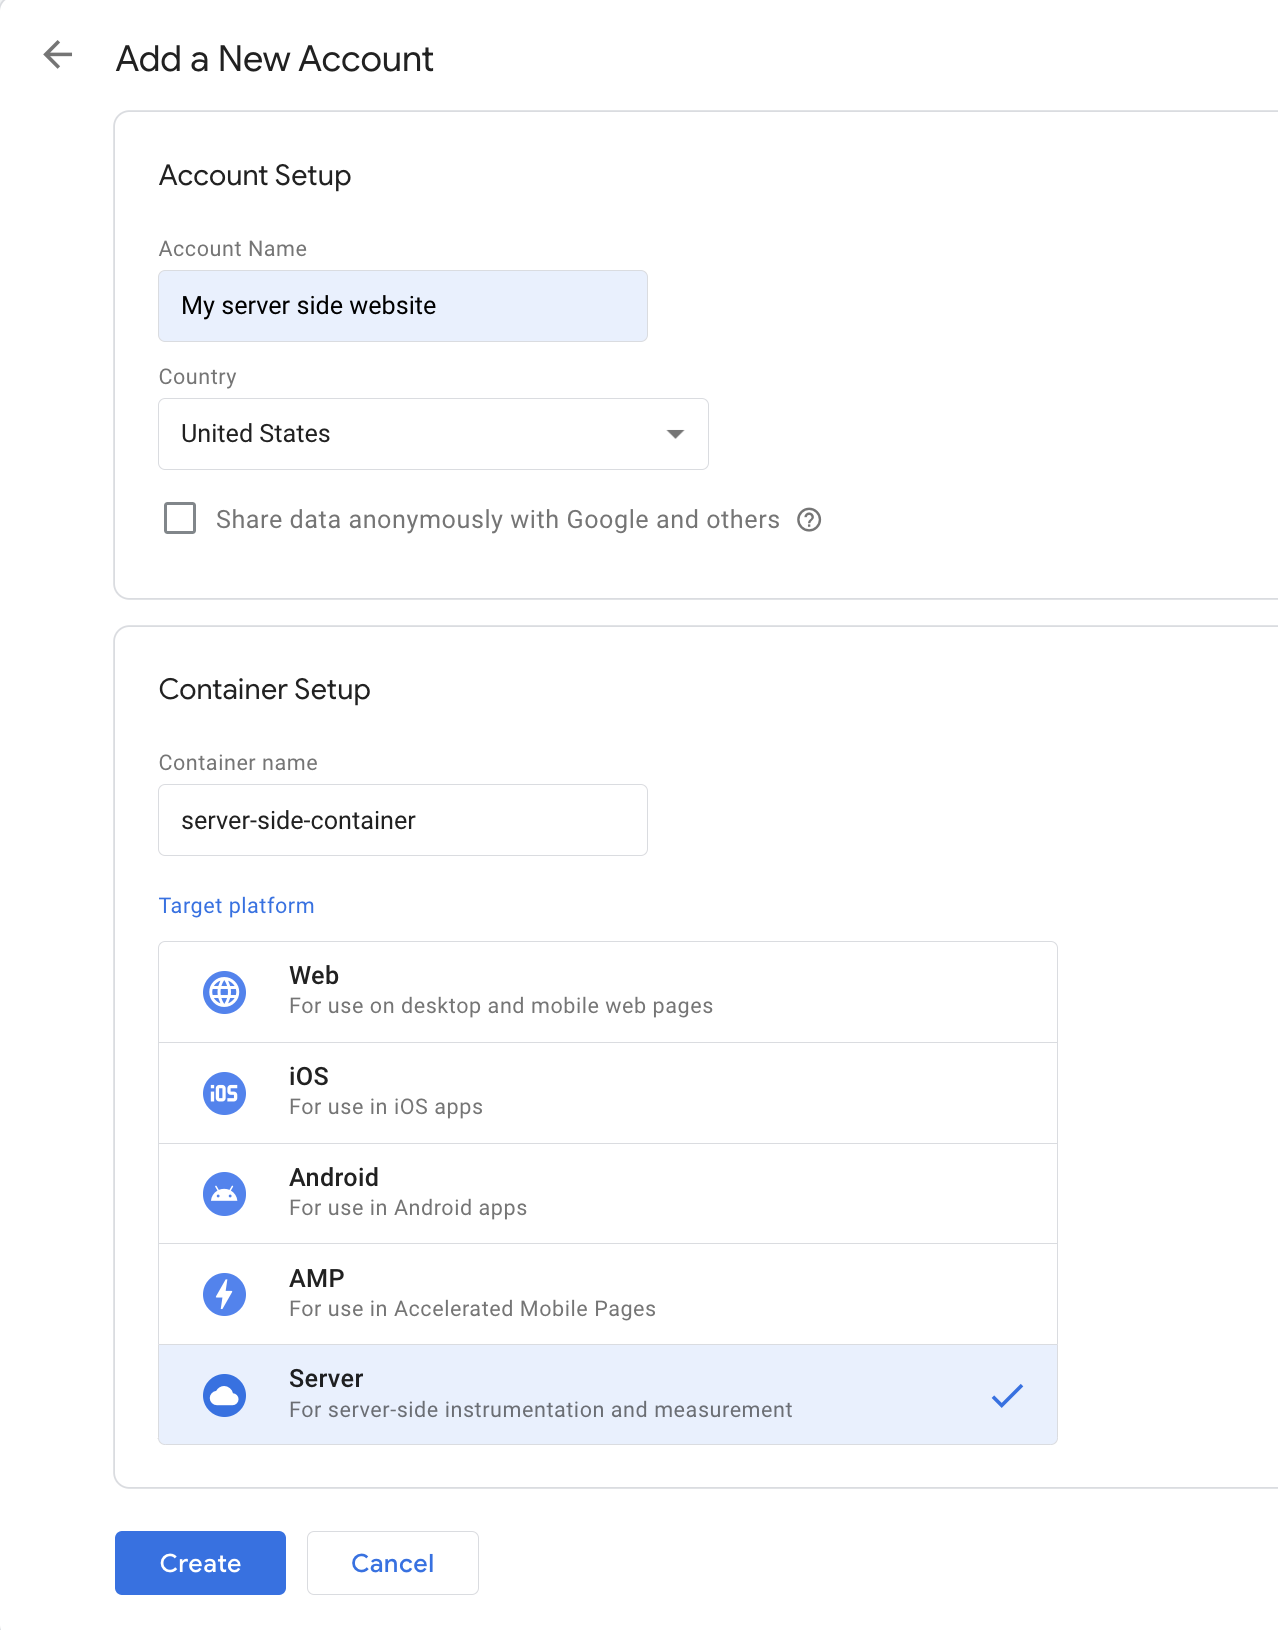
Figure 9. Screenshot showing the container setup.
Select your target platform and select Create. This will open Google Tag Manager Terms of Service Agreement. Accept the agreement and select Yes at the top right corner.
Select Create. In the dialog that appears, select Manually provision tagging server, and copy the Container Config string to a notepad.
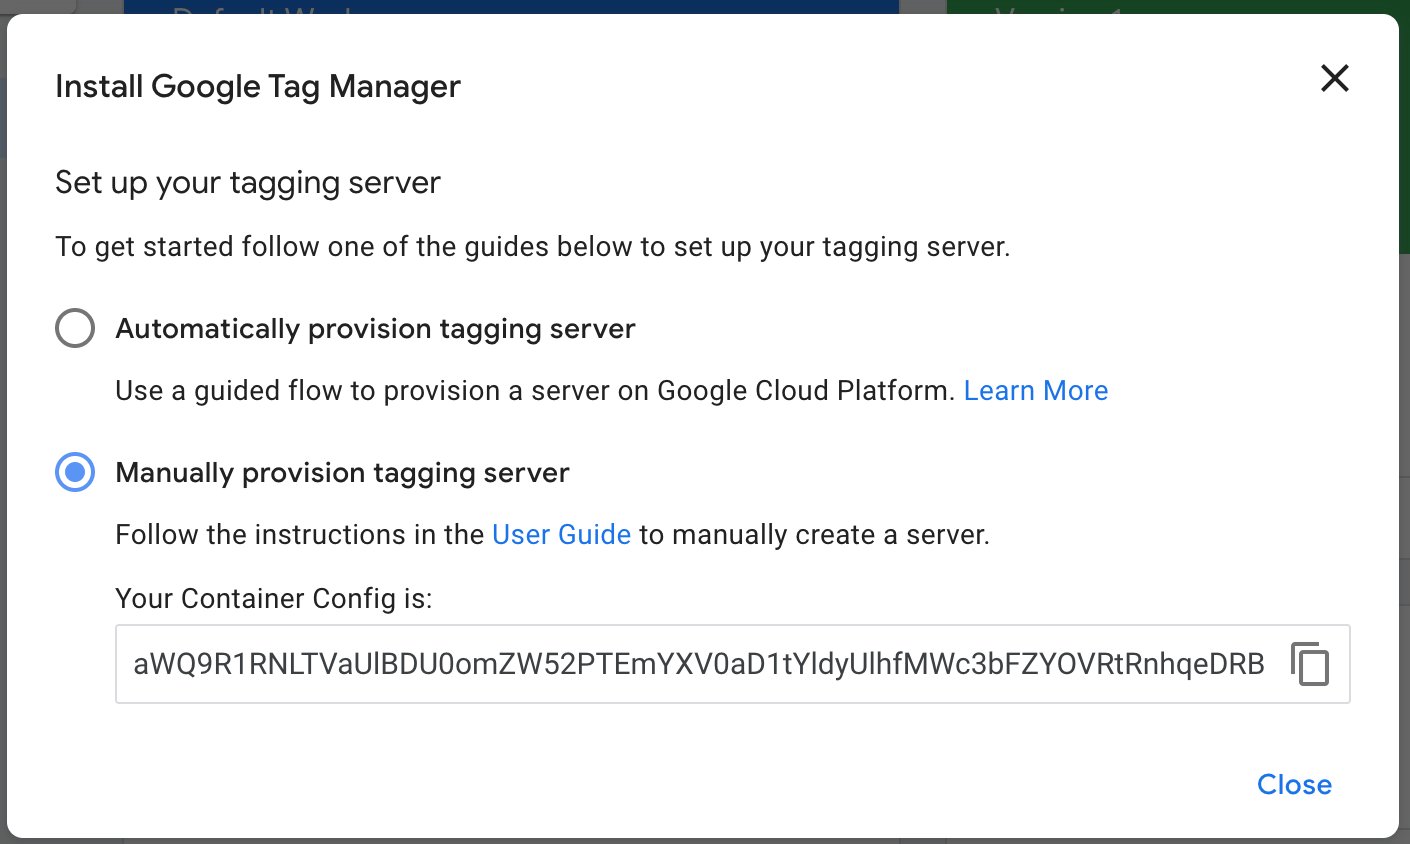
Figure 10. Screenshot showing how to install Google Tag Manager.
Once you have copied the Container Config string, go back to the Accounts overview page to create a second container.
In the Create container dialog, enter a name for the container and select Web as the type.
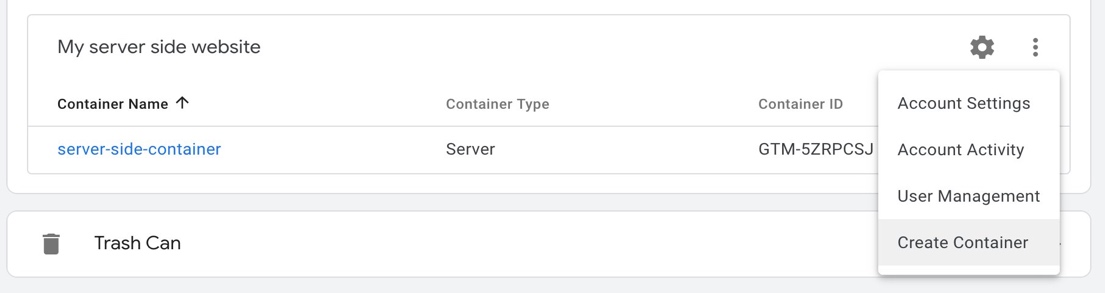
Figure 11. Screenshot showing where to create the container.
- Once you have successfully created both containers, you should see them listed together in the Accounts overview page in Google Tag Manager.
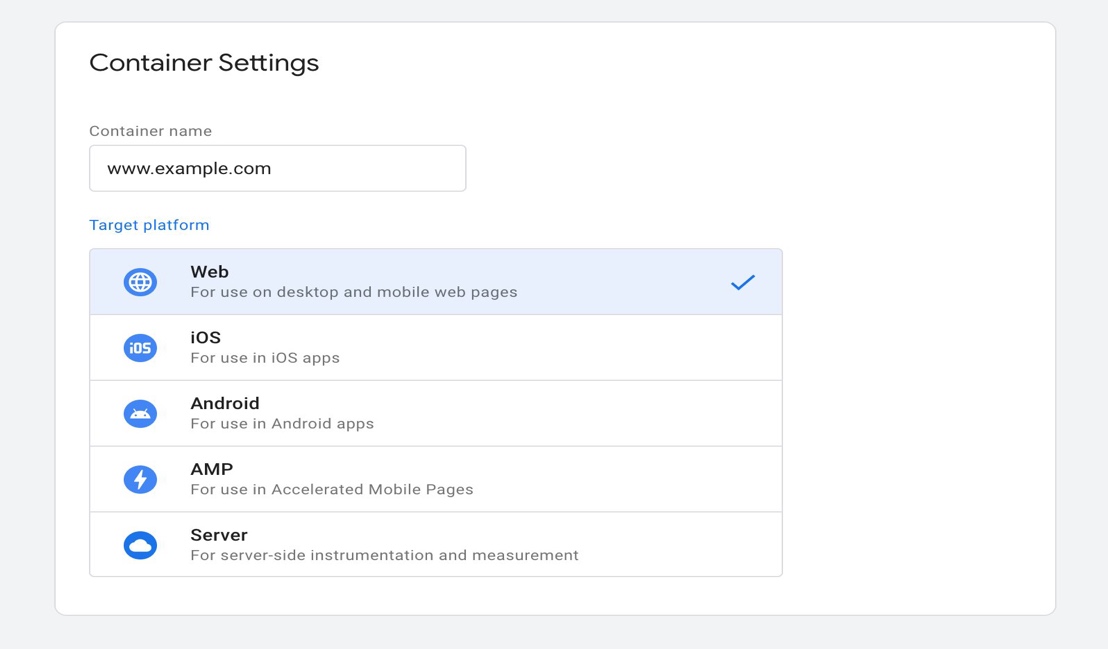
Figure 12. Screenshot showing all container settings.
Configure the Web Container
Follow the steps below to set up the web container:
- Select the Web container and create a new Trigger from the options in the sidebar menu. Add Click - All Elements from the options and save the new Trigger.
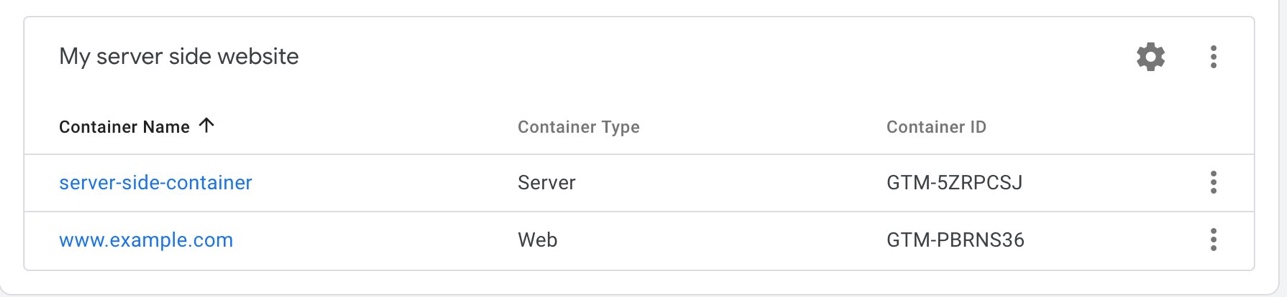
Figure 13. Screenshot showing container name, type, and ID.
Next, create a new Tag from the sidebar menu. Follow these steps in the Tag settings:
a. Select Google Analytics: GA4 Configuration from the list of choices.
b. Enter the Measurement ID you noted in the Google Analytics Setup section of this implementation guide.
c. Select the Send to server container setting, and add the URL of your Primary Server-Side Container that you chose in the Prerequisites section of this implementation guide.
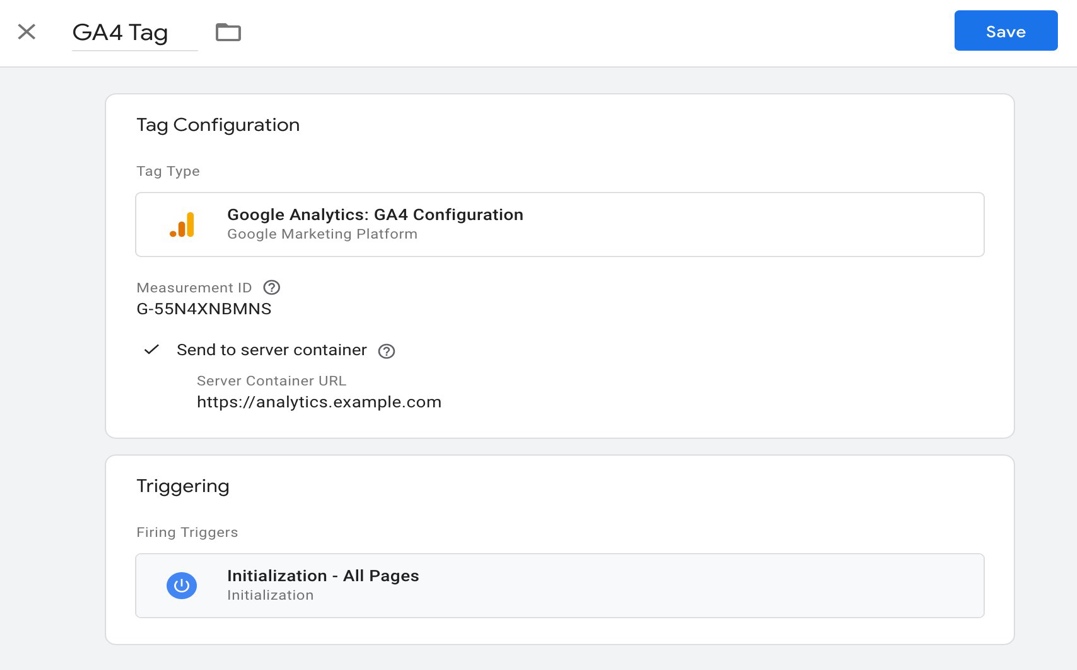
Figure 15. Screenshot showing Tag Configuration and Triggering.
- In the Triggering section of the dialog, add a Trigger for Initialization - All Pages from the list of options.
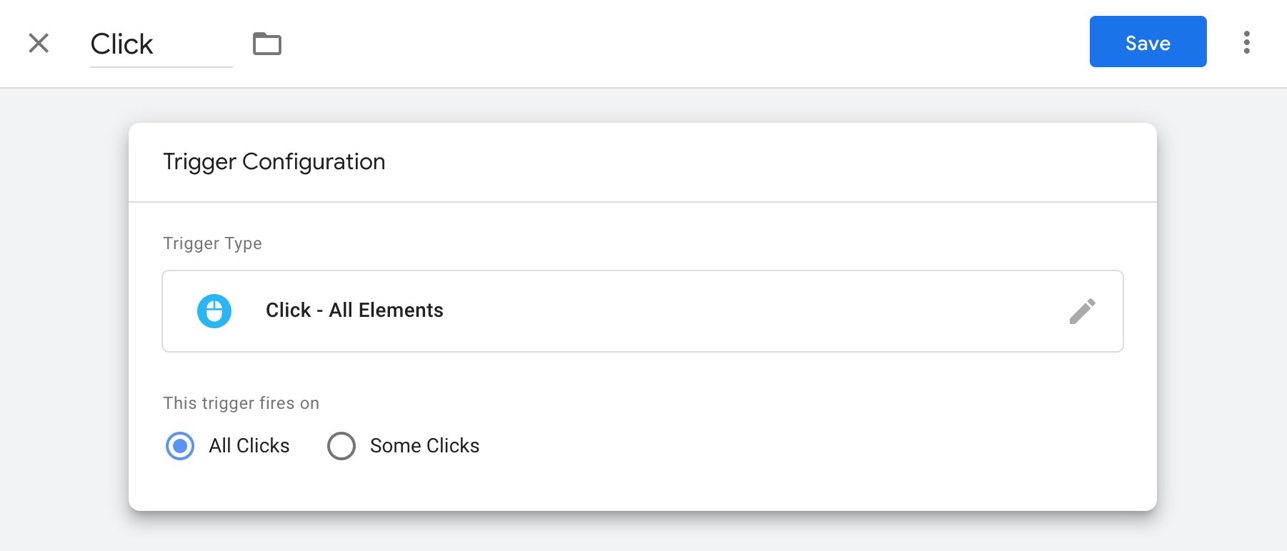
Figure 14. Screenshot showing the Trigger Configuration.
You have now configured Google Tag Manager to send tag data to your Server-Side Container on the initialization of every page.
Server-Side Tag Manager Deployment
Next, you will log into the AWS Console and deploy the Primary Server-Side Container as well as the Preview Container on Amazon ECS on AWS Fargate.
Create and Configure a VPC
If you don’t already have an Amazon Virtual Private Cloud (Amazon VPC) configured, you will need to create one in the AWS Console. Follow the steps below to create a VPC.
Log in to AWS Console. Confirm you are logged in to the correct AWS Region.
Navigate to Create VPC wizard by selecting the VPC and more option in the Create VPC dialog.
For a public facing Amazon ECS deployment, you will need to create a VPC with both private and public subnets and at least one AWS Managed NAT Gateway.
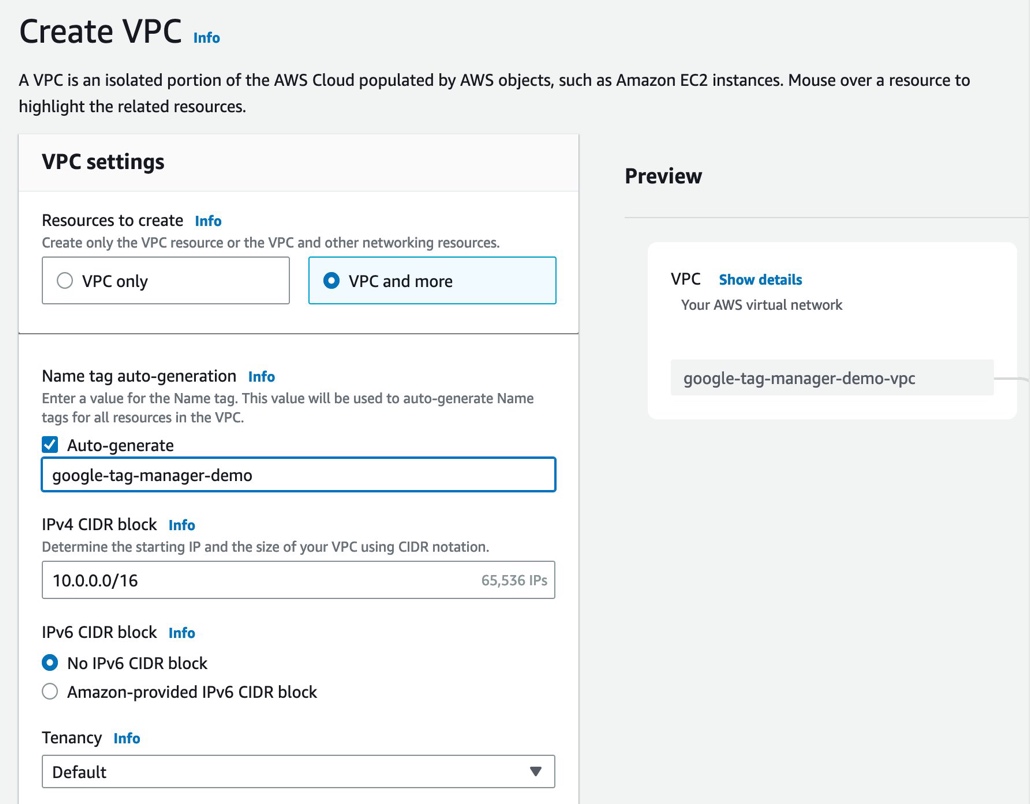
Figure 16. Screenshot showing how to create a VPC.
As a best practice, select at least 2 Availability Zones (AZ) to ensure high availability. You may also choose to deploy either a single AWS Managed NAT Gateway or one per AZ in this dialog. When deciding how many AWS Managed NAT Gateways to deploy, consider the tradeoff between resiliency and cost. Each AWS Managed NAT Gateway has an associated hourly running cost.
The new Create VPC Wizard will show you a preview of all the resources it will create. It should show a private and public Subnet for each AZ along with the corresponding Route Tables. The configured network connections for the AWS Managed NAT Gateway and an Internet Gateway will appear on the far right. A VPC Gateway Endpoint for Amazon S3 will also be shown if you left that as the default setting.
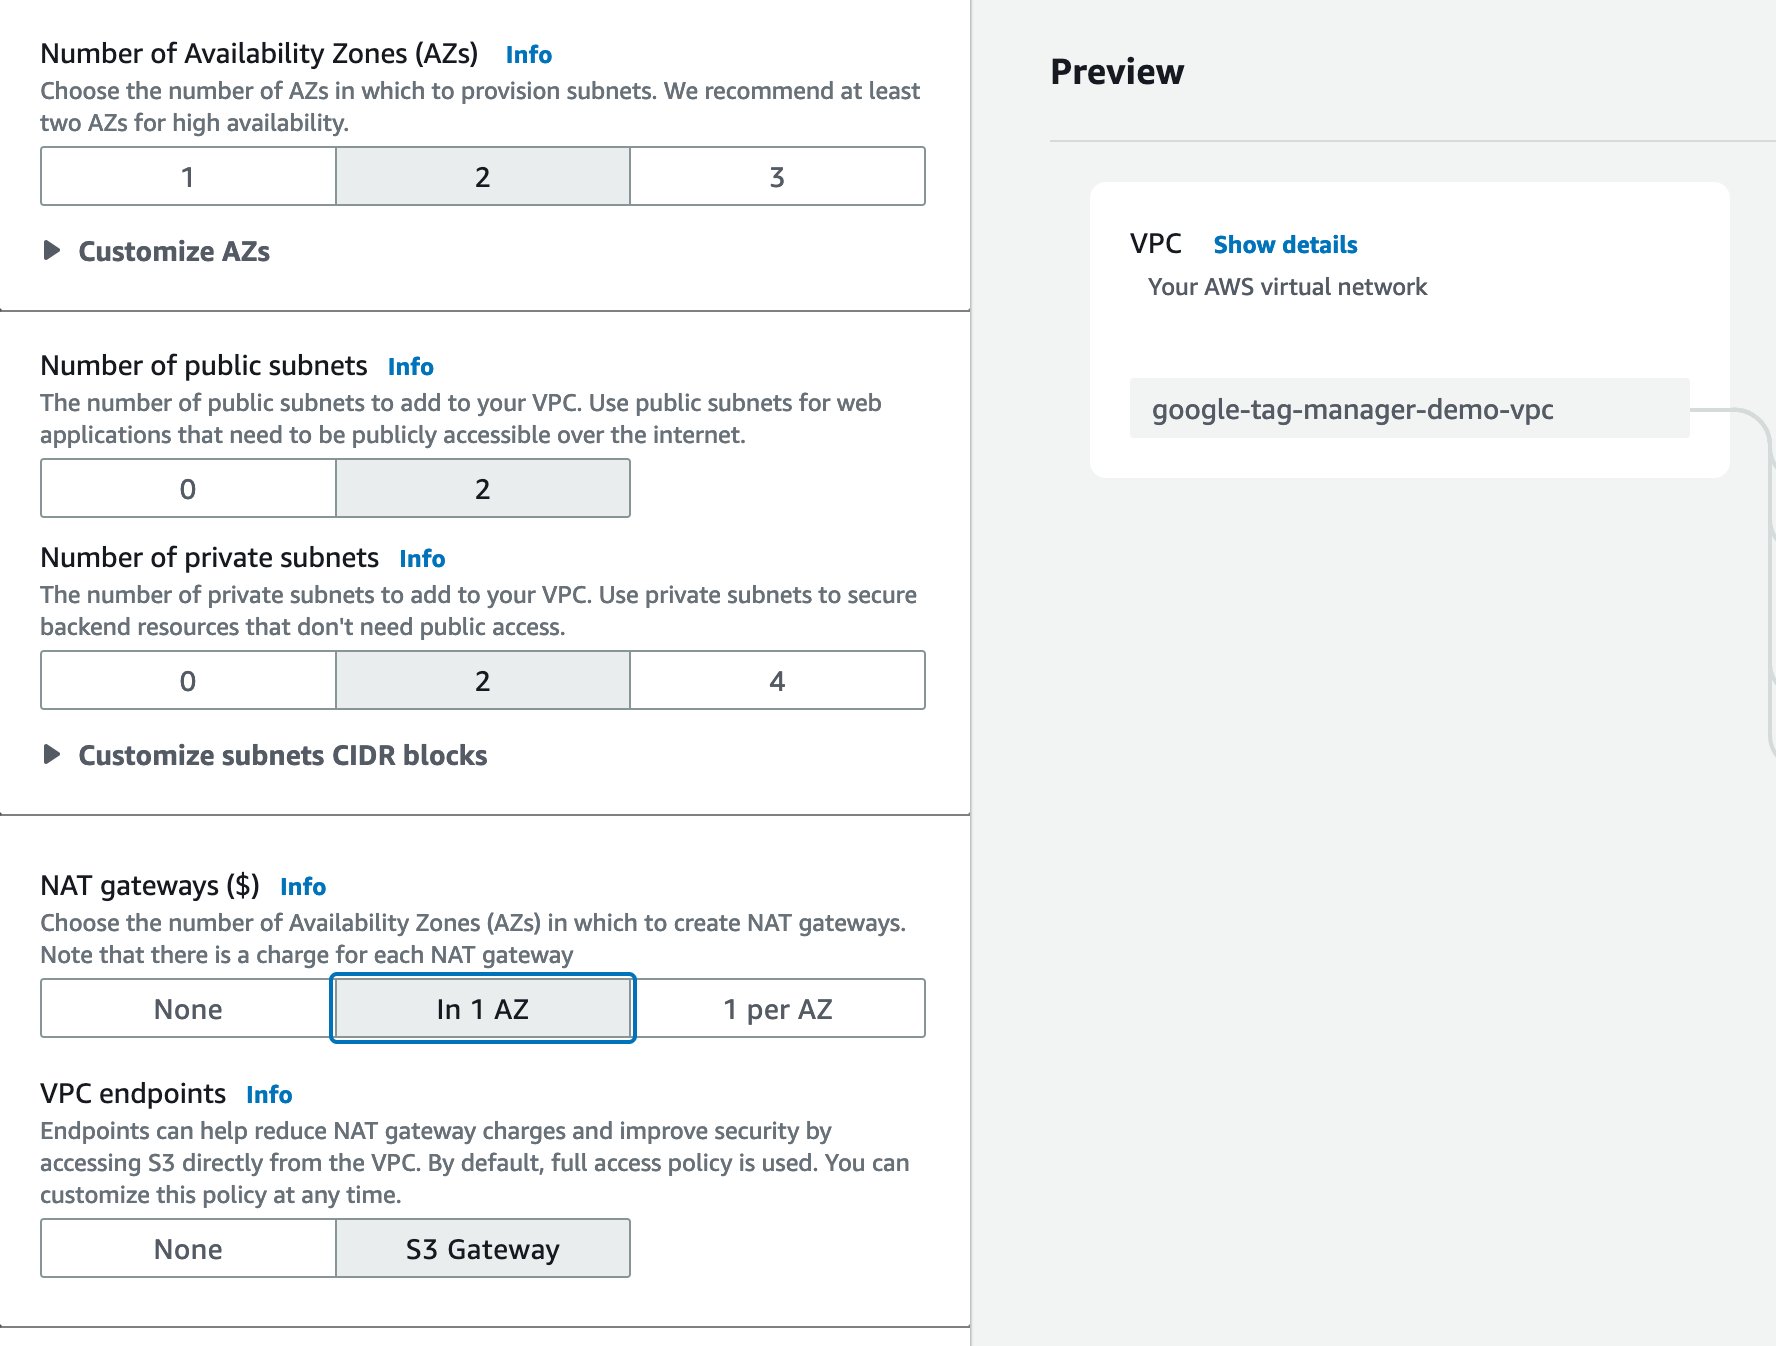
Figure 17. Screenshot showing Availability Zones, public subnets, private subnets, NAT gateways, and VPC Endpoints.
- Once you have reviewed the VPC Preview, select the Create VPC. button at the bottom.
Create an Amazon ECS Cluster
Follow the steps below to create an Amazon ECS cluster:
From the Amazon Elastic Container Service dashboard, select Create Cluster.
In the Create cluster dialog:
a. Name your cluster.
b. Select the VPC you created in the previous section of this implementation guide.
c. You will also need to select all the subnets where your containers will run. These should be all of the private subnets you created in the previous section of this implementation guide.
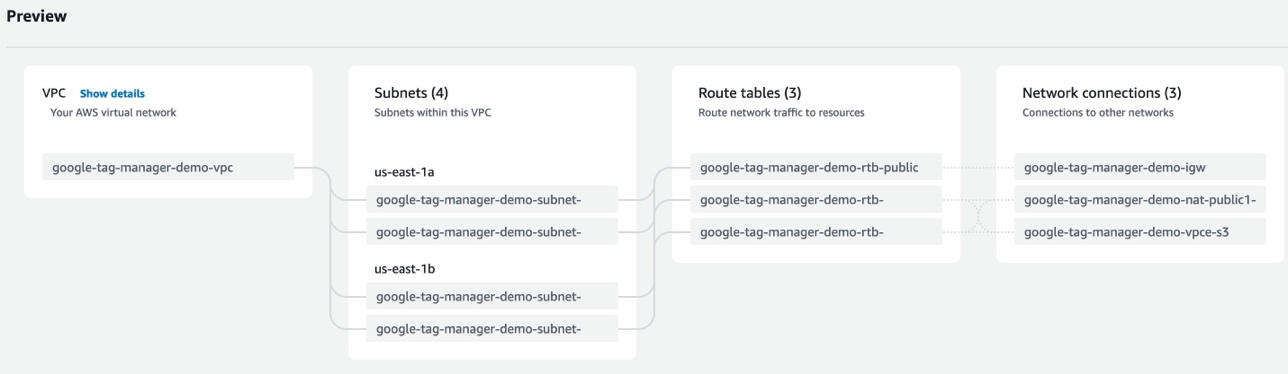
Figure 18. Screenshot showing the subnets, route tables, and network connections in your VPC.
d. In the bottom section of the Create cluster dialog, leave all the options as their default settings. For the purposes of this implementation guide, use AWS Fargate (serverless) as the capacity provider.
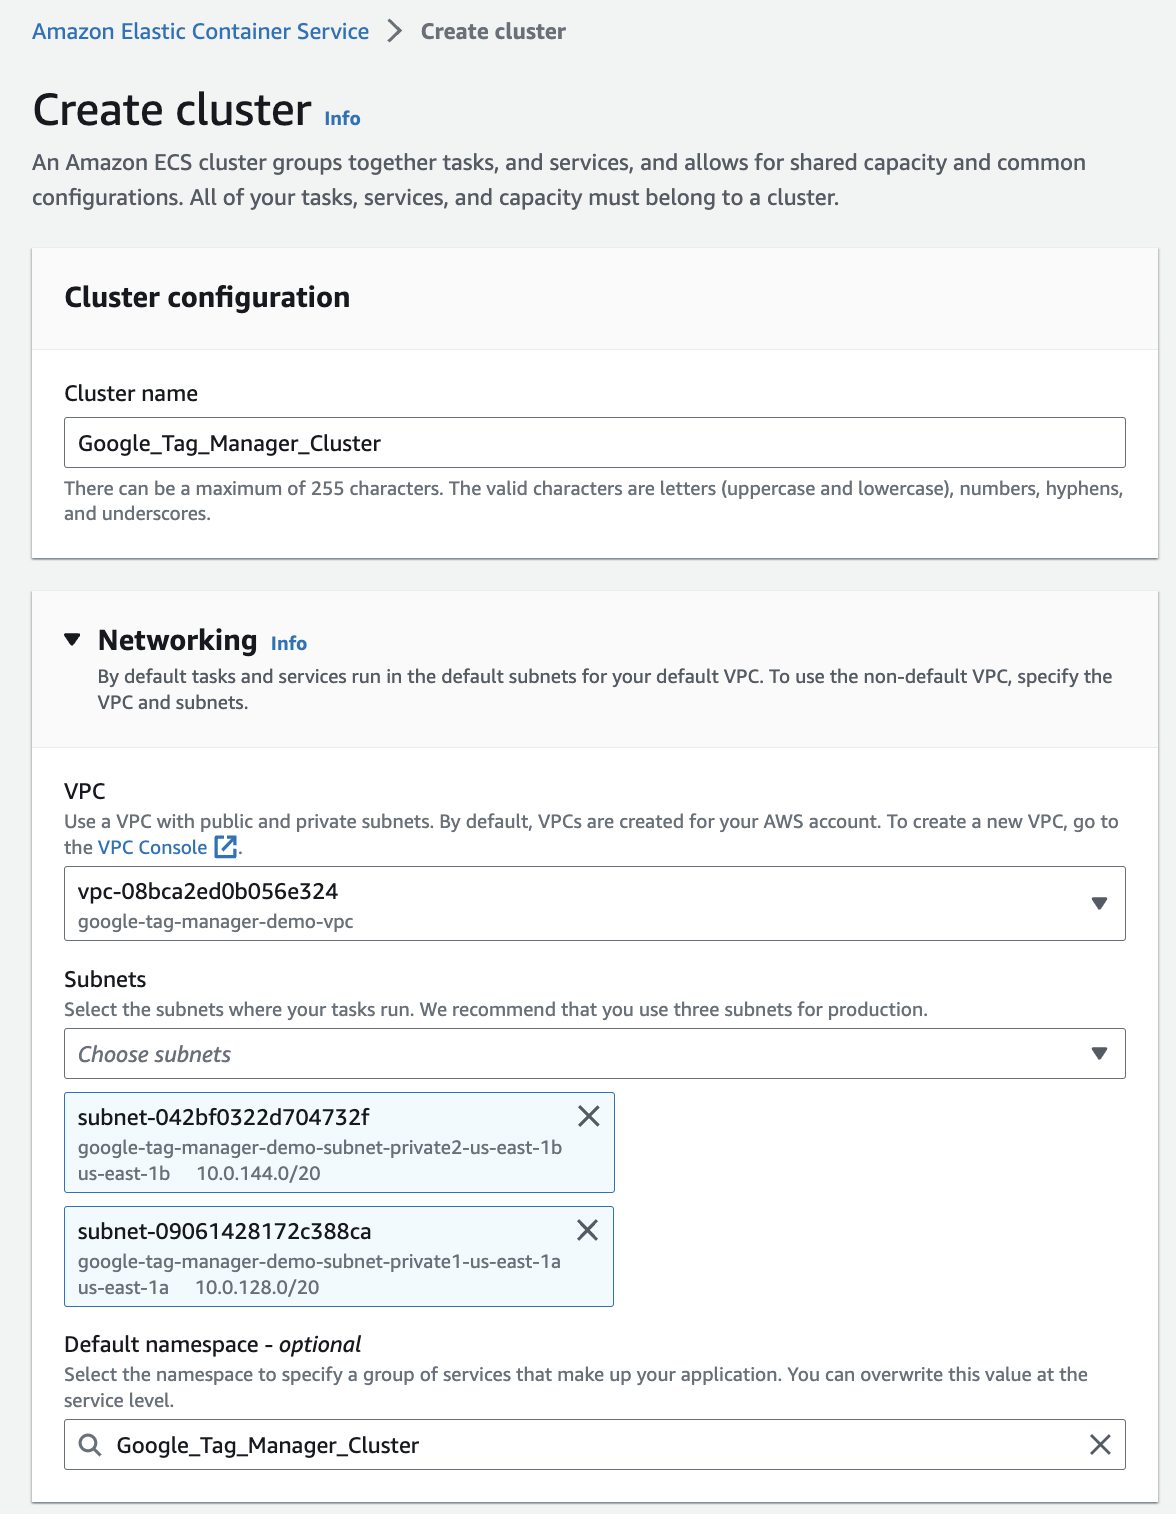
Figure 19. Screenshot showing the Create cluster details.

Figure 20. Screenshot showing where to select AWS Fargate (serverless).
e. Once all of your settings are correct, select the Create button.
Create Task Definitions
Google’s Server-Side Container requires two separate Tasks to be running as separate services. To configure this through the AWS Console, use the following steps:
Select the sidebar menu item for Task definitions and select Create new task definition.
Define the Primary Server-Side Container Task.
- In the Create new task definition dialog, enter a name for the Primary Server-Side Container Task. You will also need to specify the URI for the container itself (gcr.io/cloud-tagging-10302018/gtm-cloud-image). For port mappings, simply map port 80 on the container to port 80 on the host.
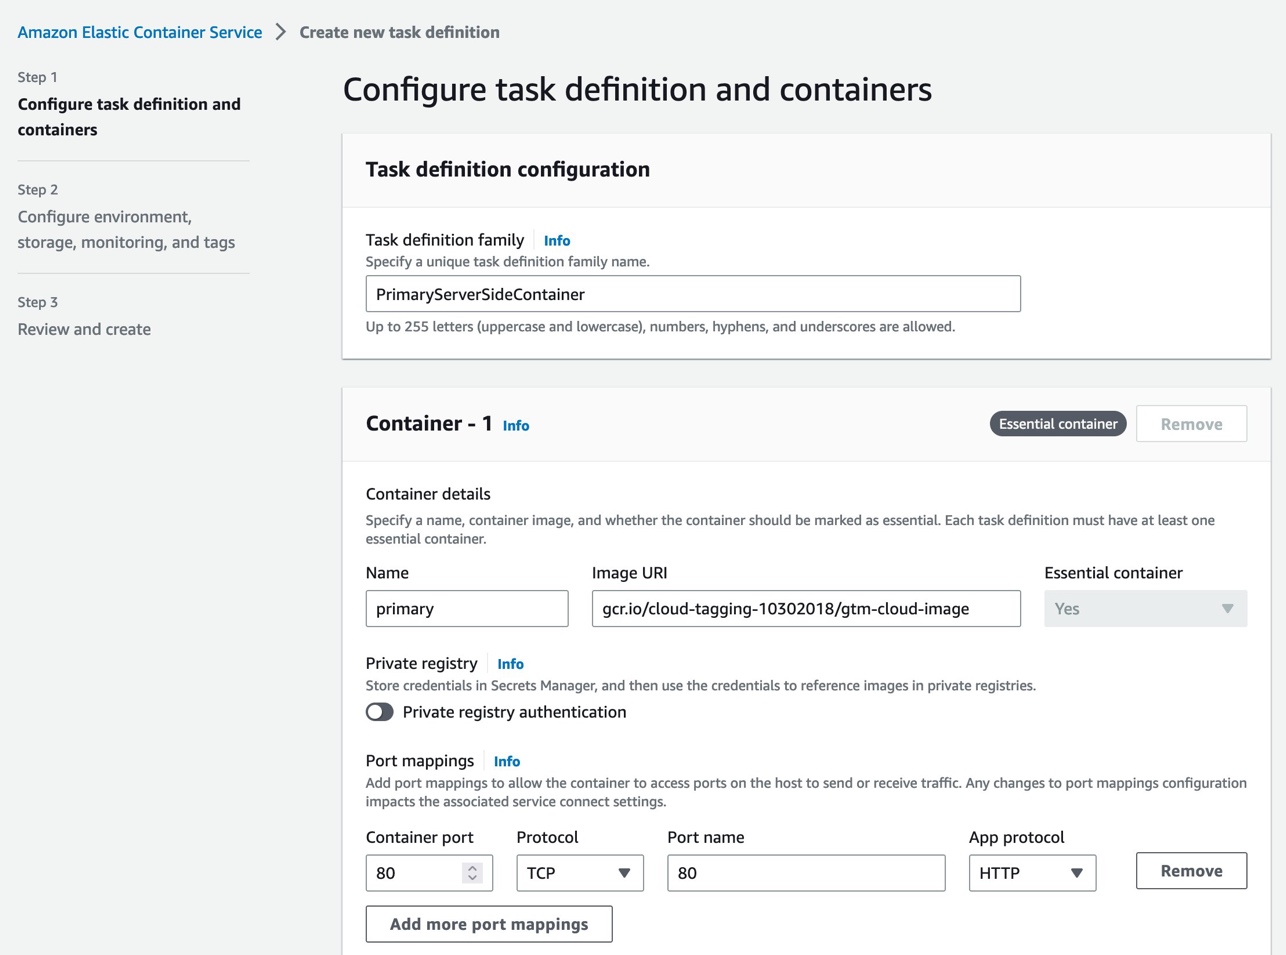
Figure 21. Screenshot showing how to configure task definition and containers.
In the bottom section of the same dialog, add the following three environmental variables:
a. CONTAINER_CONFIG - This is the long string you copied during the Google Tag Manager Setup.
b. PORT – 80
c. PREVIEW_SERVER_URL - This is the domain name you came up with in the Prerequisites section of this implementation guide for the Preview Container. (https://preview-analytics.example.com)
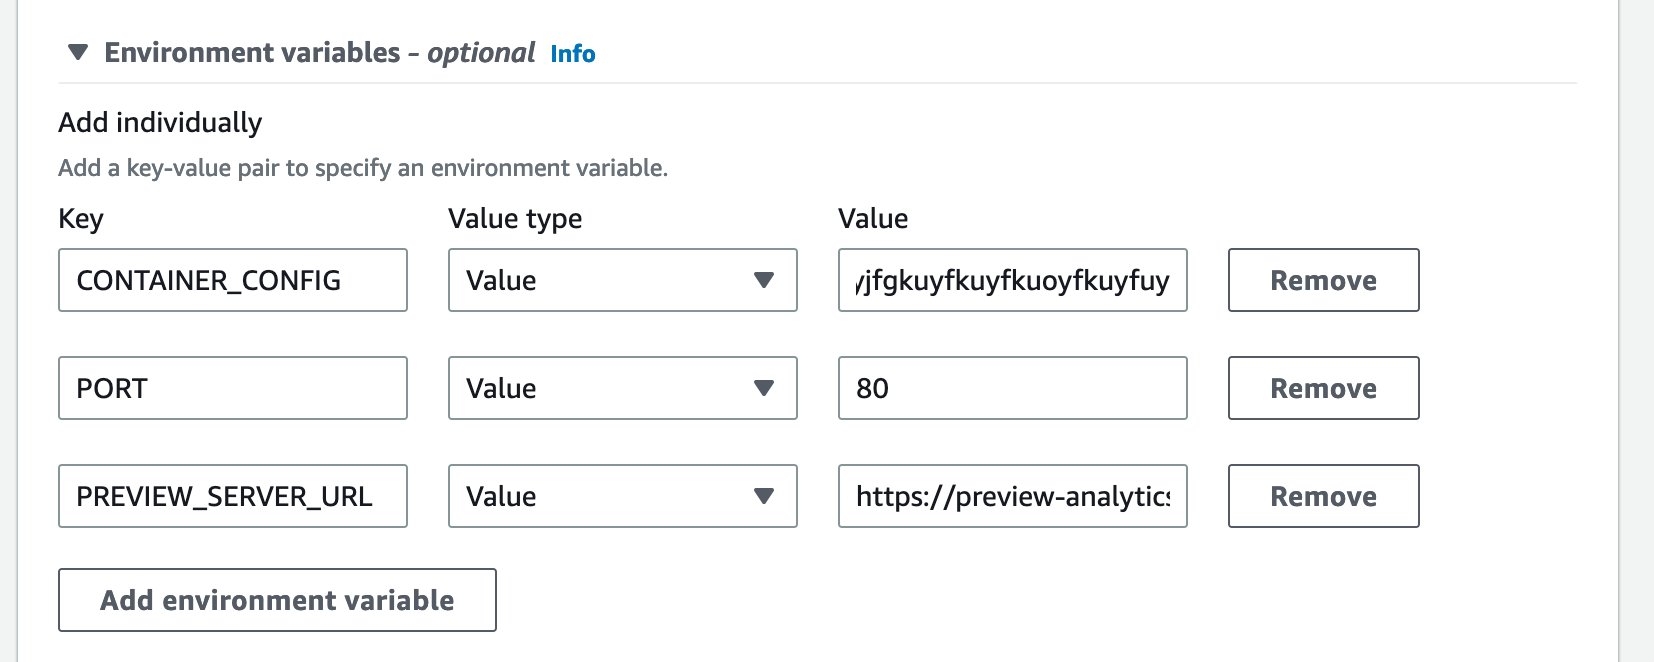
*Figure 22. Screenshot showing environment variables.*
Repeat Steps 3a-3c above for the Preview Container Task.
a. To create a new task definition, select the sidebar menu item for Task definitions and select Create new task definition.
b. Add the following environment variables:
CONTAINER_CONFIG - Same as above
PORT – 80
RUN_AS_PREVIEW_SERVER - true
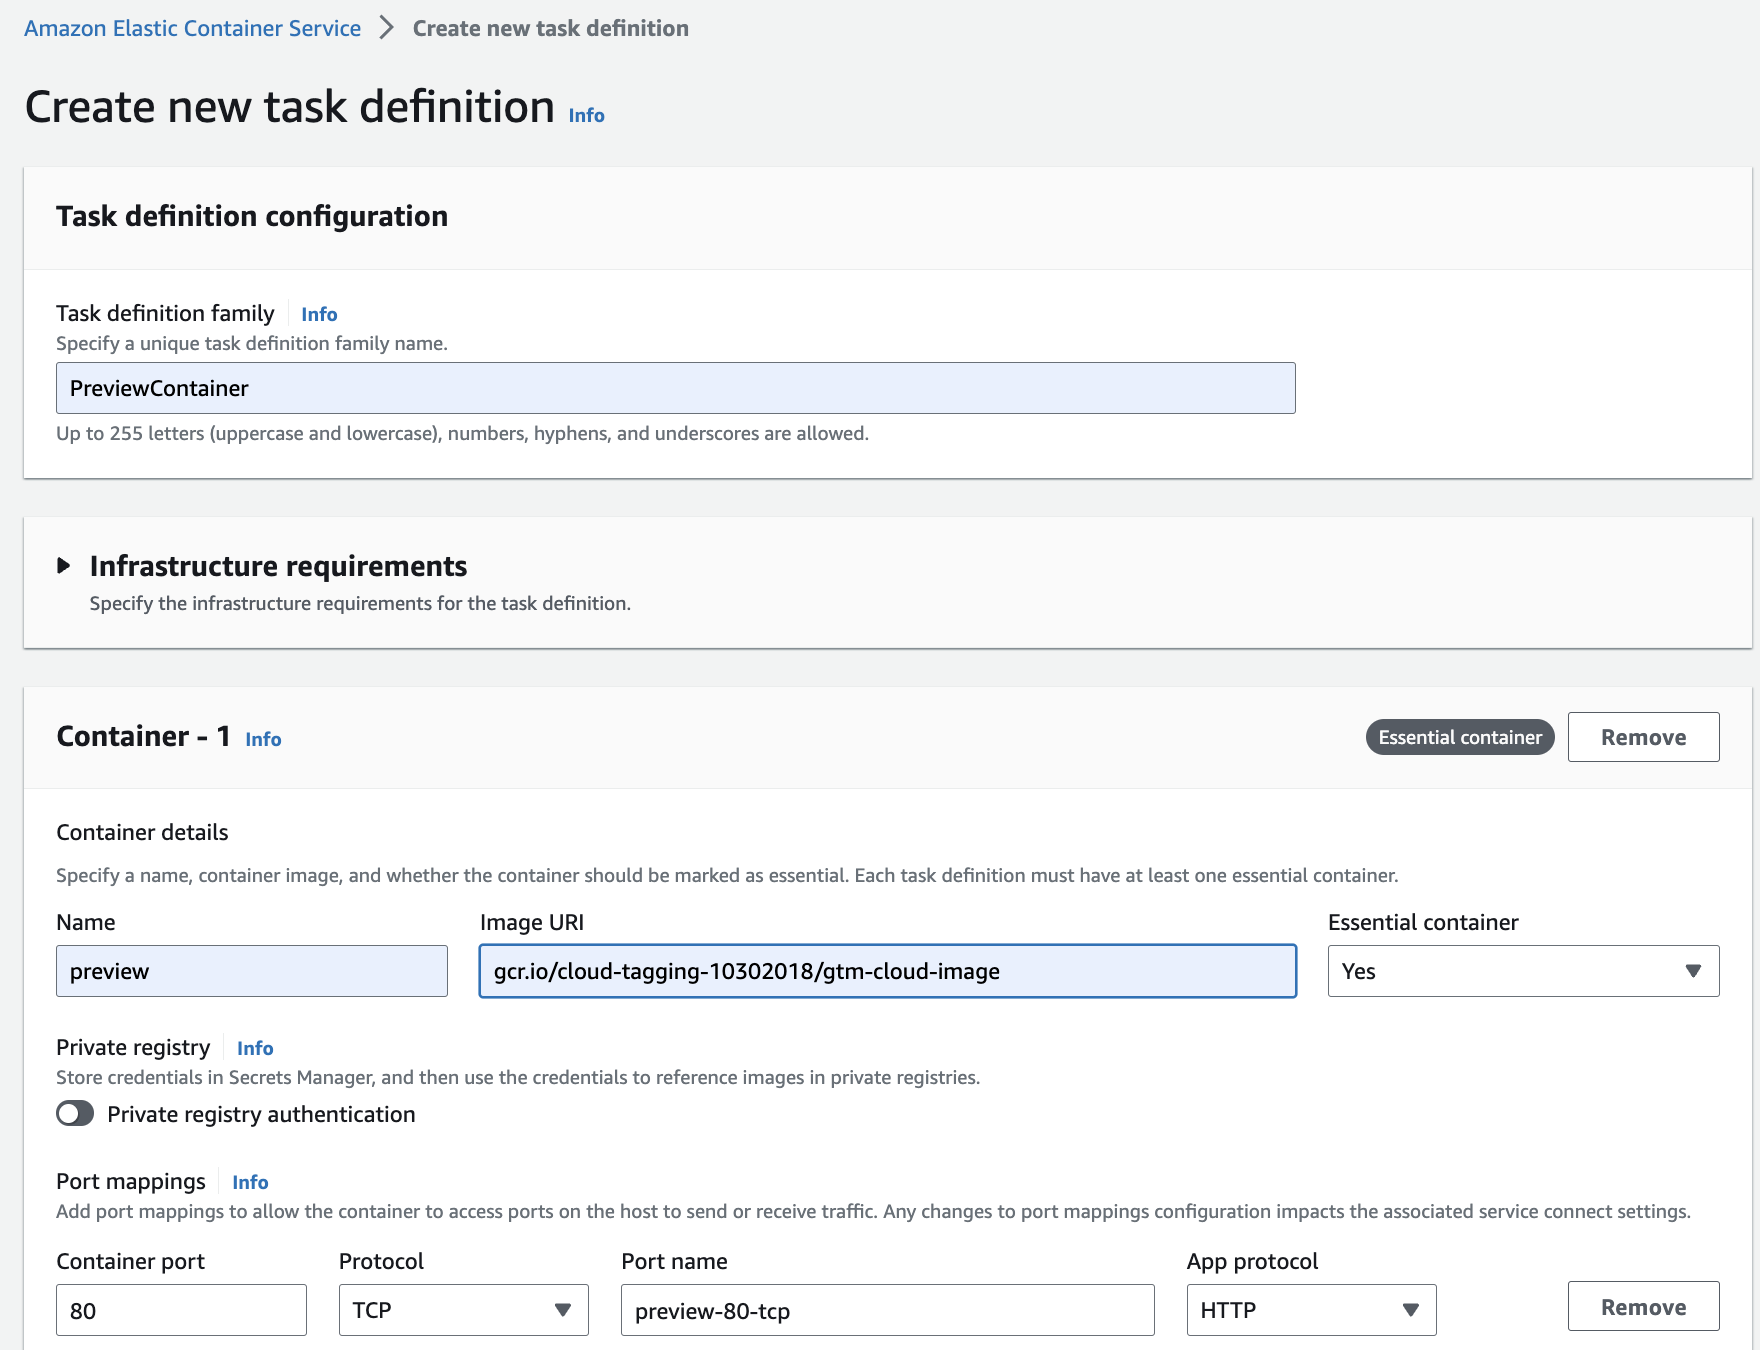
Figure 23. Screenshot showing how to create a new task definition.
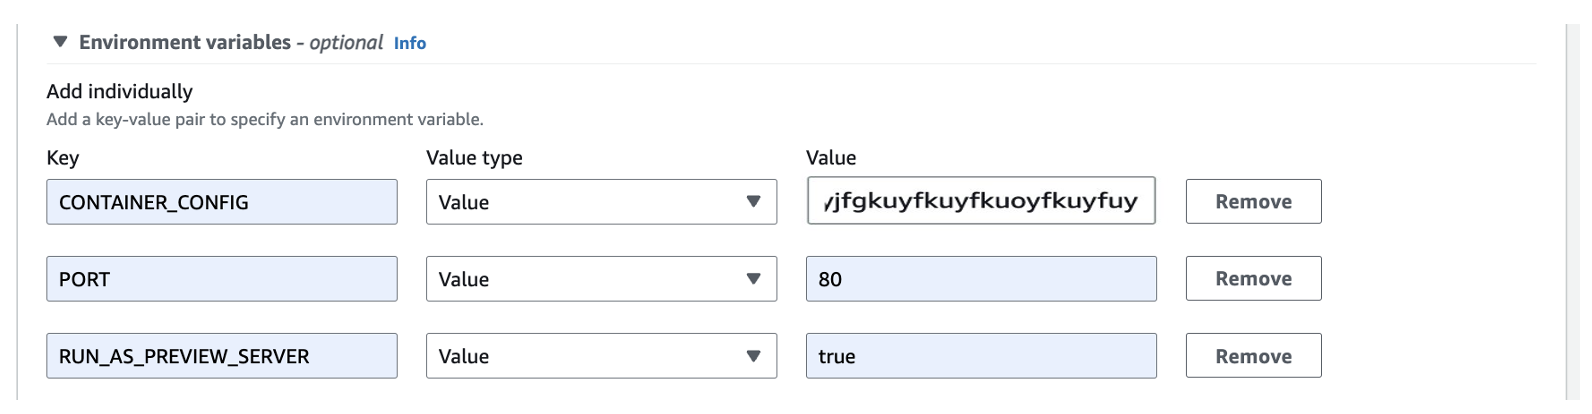
Figure 24. Screenshot showing environmental variables with default values.
c. Select the Create button to finish this step.
Create Services
Next, create an Amazon ECS service for each of the two Task definitions we created in the previous section.
- Head to your Amazon ECS Cluster in the AWS Console. Under the Services tab, select the Create button. This should prompt the dialog shown in the Figure below to appear. In the top section of the dialog, you can choose to leave all the default values as they are.
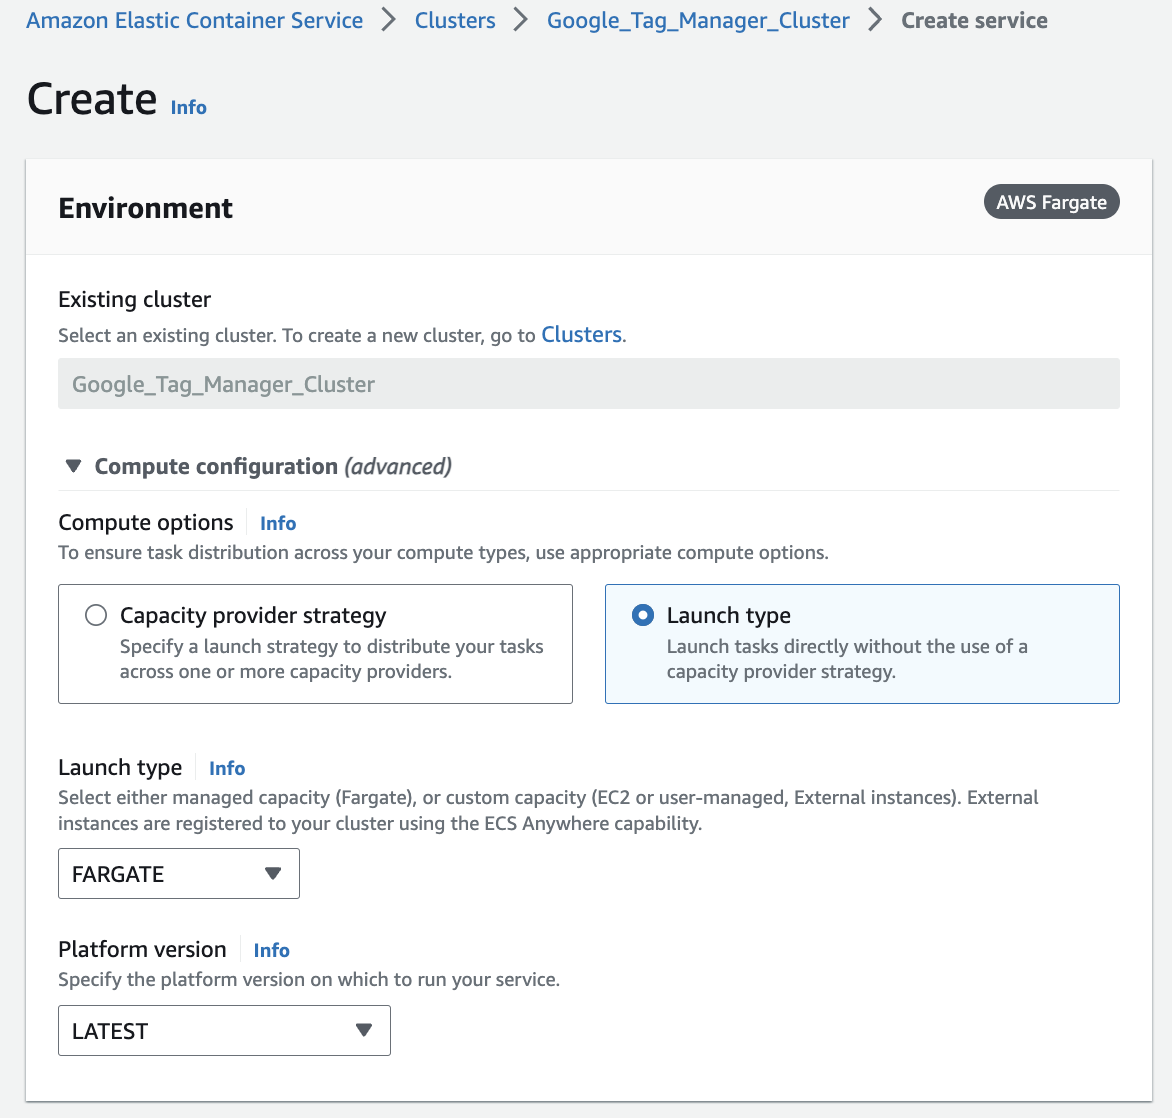
Figure 25. Screenshot showing the existing cluster.
Under Deployment configuration, select your Task definition from the dropdown, and provide a name for the service.
a. Under Desired tasks, select at least one task for each Availability Zone you wish to support. You can increase these numbers to add additional capacity, or set up auto-scaling if you are working with an unpredictable amount of traffic.
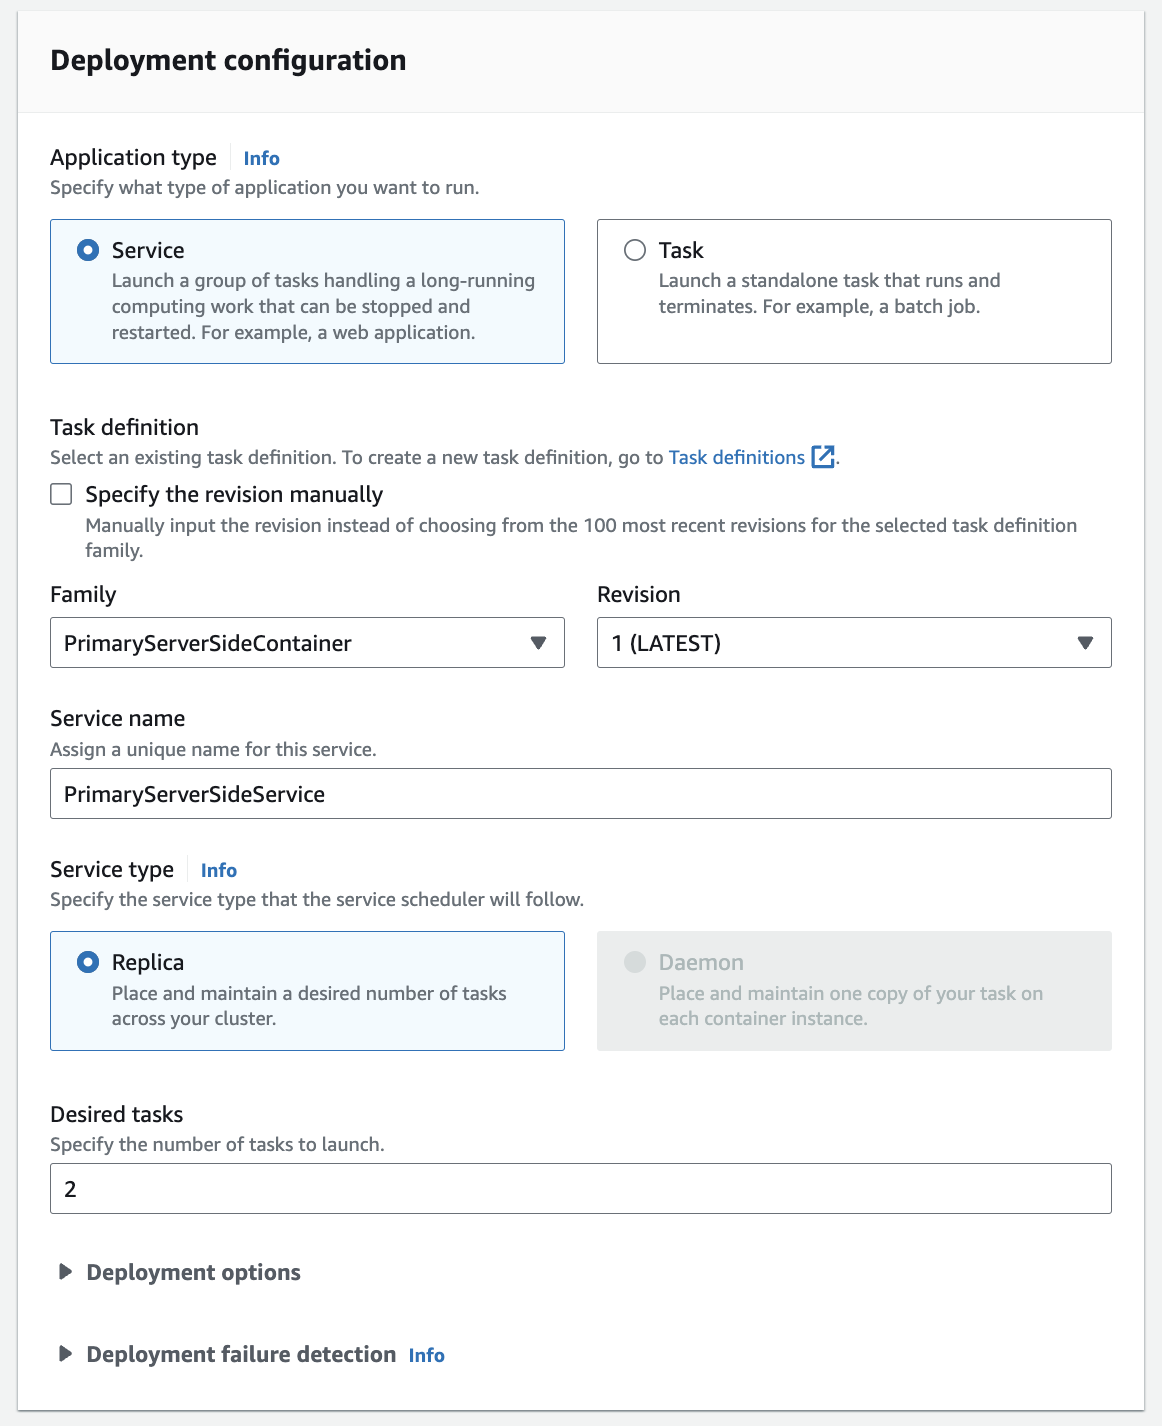
Figure 26. Screenshot showing deployment configuration details.
- Under the Networking section, select your VPC from the dropdown, and add all the private subnets you created when setting up the VPC. For the security group setting, you can choose the default security group, or create a new one with rules to allow traffic from any other resources within the same security group.
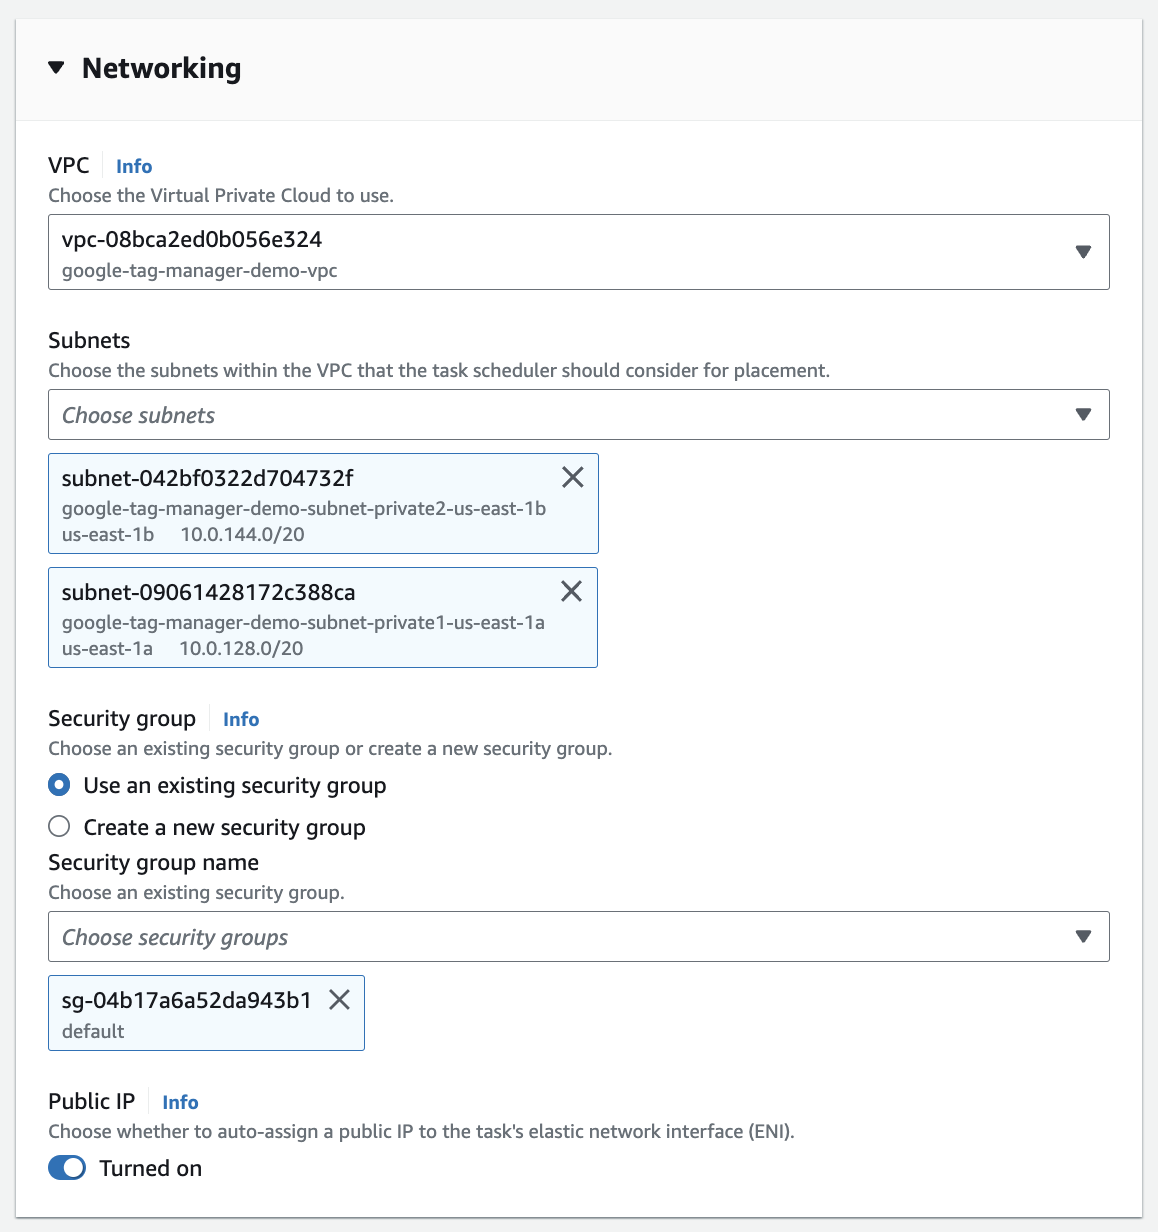
Figure 27. Screenshot showing network details.
- For Load balancing, select Application Load Balancer, and create and name a new load balancer. By default, the load balancer will balance traffic from port 80 to a Target Group you specify. Change this to Port 443 with the Protocol set to HTTPS. Selecting this option will reveal a new dropdown where you can select the Certificate you created in the Prerequisite section of this implementation guide.
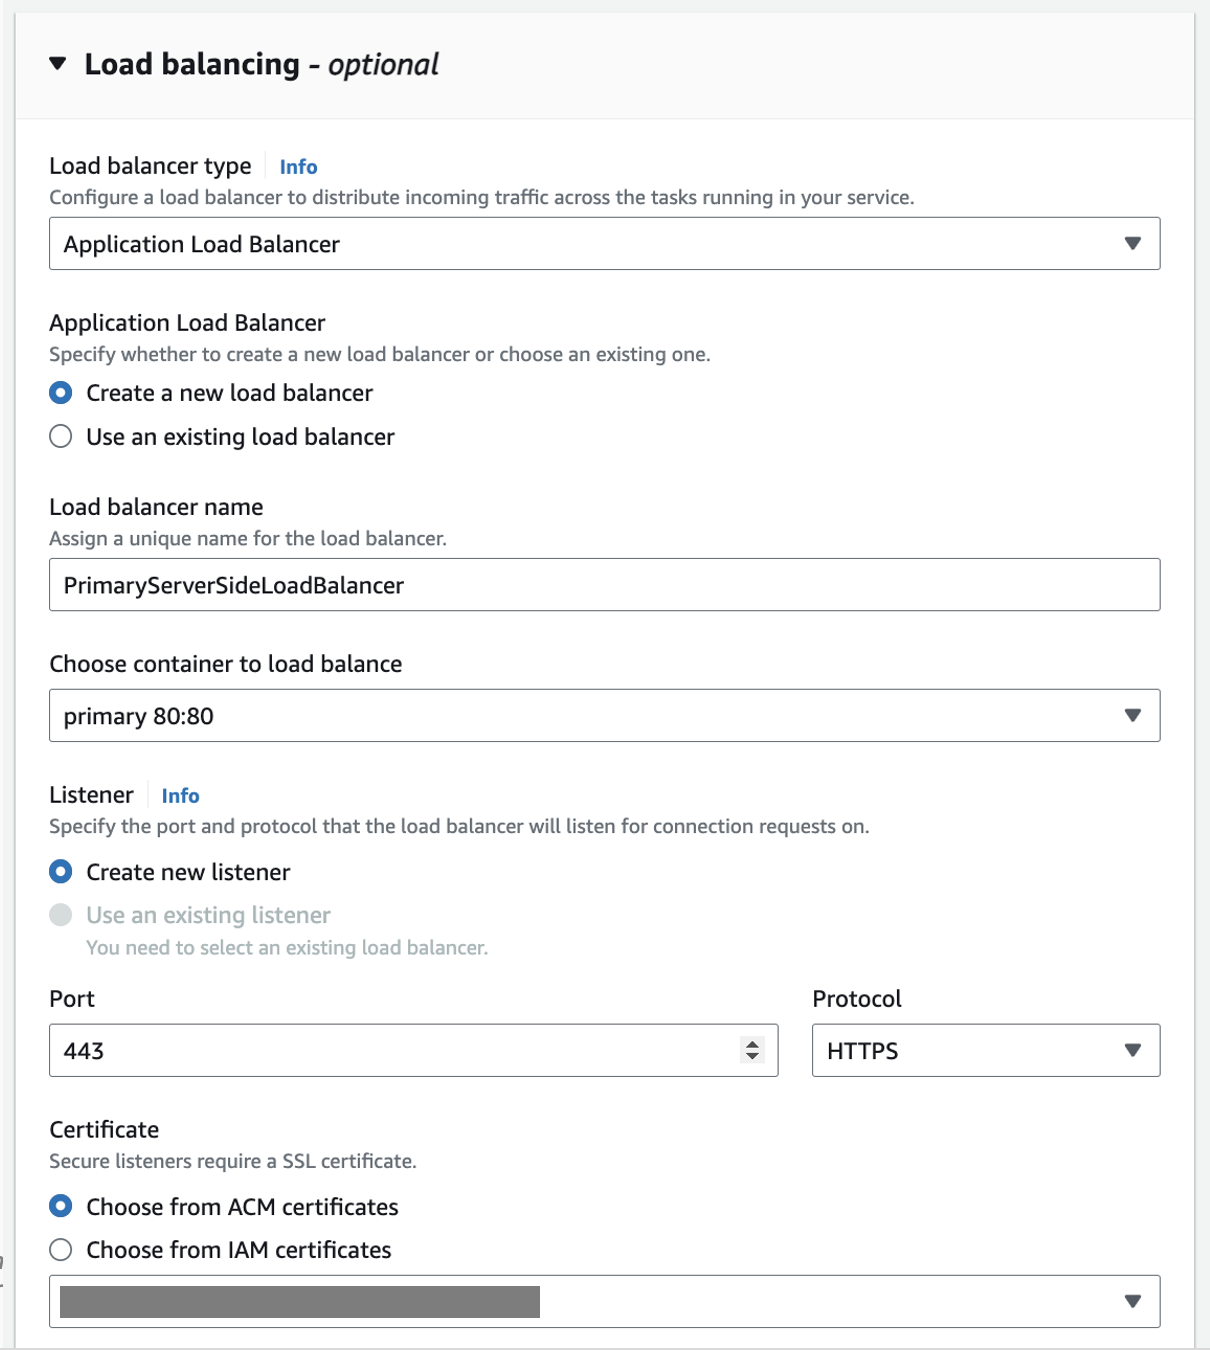
Figure 28. Screenshot showing Load balancing details.
- In the Target group section, name your Target Group, and set the health check path to “/healthz”. You can optionally add Health check grace time to give your container some time to start up. The Figure below shows a container with a 120-second grace period.
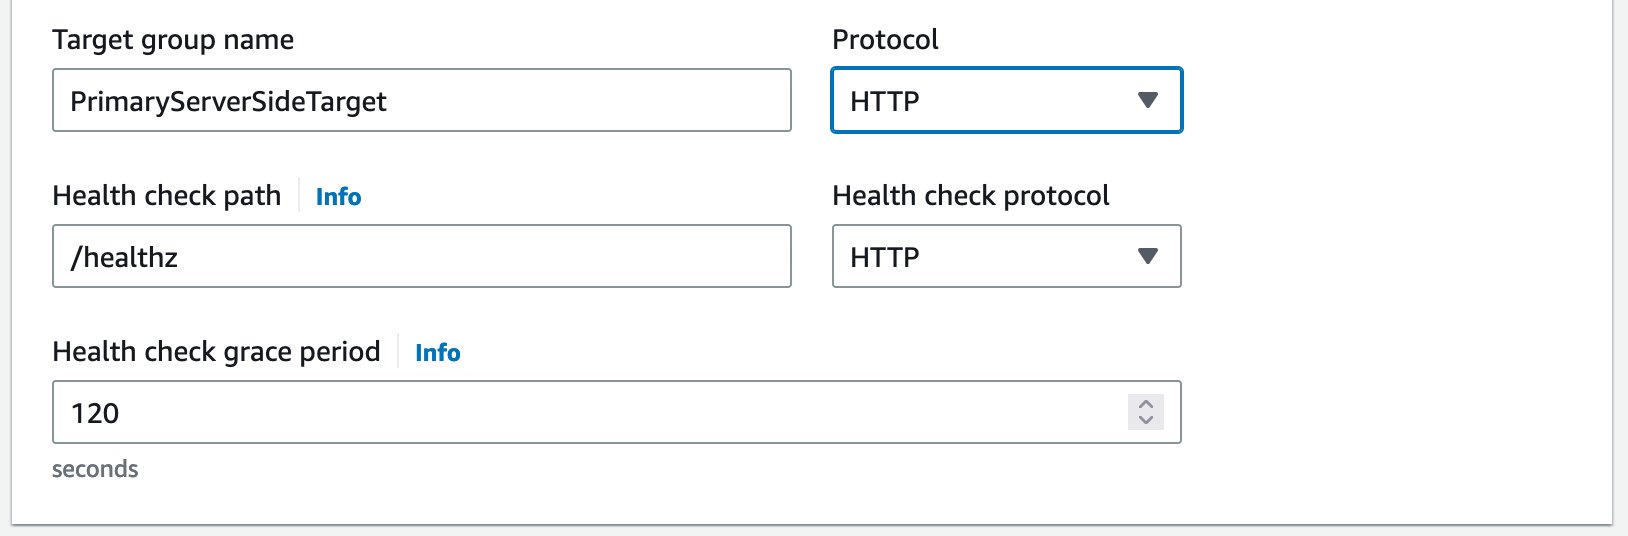
Figure 29. Screenshot showing an ECS container with a 120-second grace period.
- Once you have double-checked your service configuration, select the Create button. It will take some time to deploy all the resources you’ve specified.
Repeat Steps 1-6 for the Preview Service and select the existing load balancer and listener.
a. Go back to your ECS Cluster in the AWS Console. Under the Services tab, select the Create button.

Figure 30. Screenshot showing a single task for the preview service.
b. The preview service doesn’t need to be deployed across multiple Availability Zones, so you can select a single task as shown below.

Figure 31. Screenshot showing deployment configuration details.
c. For the networking section, select your previously created VPC and private subnets.
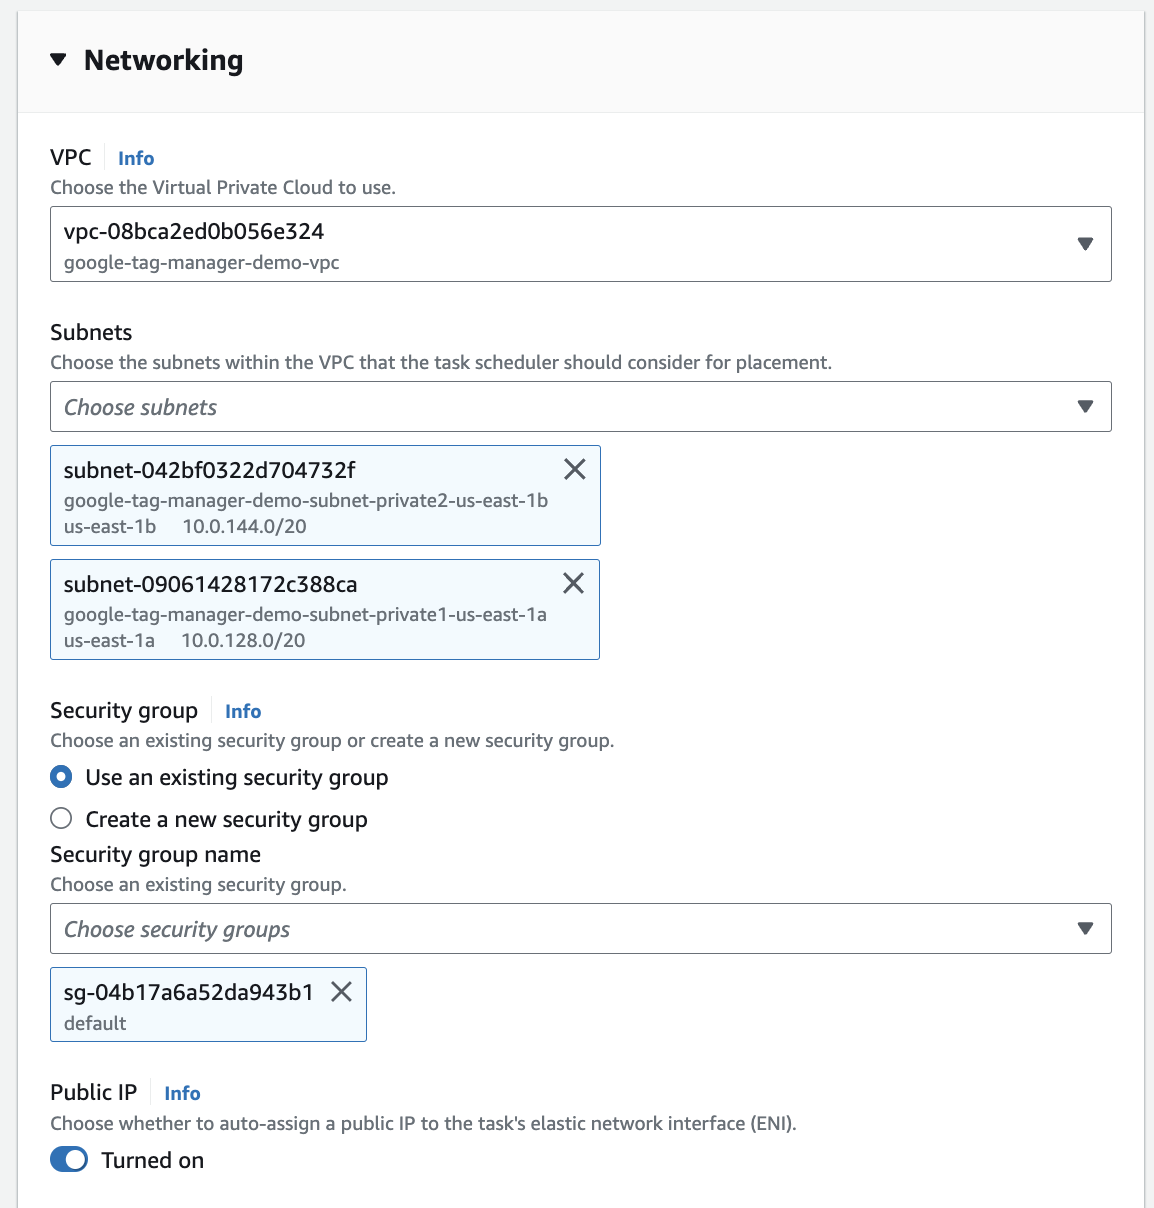
Figure 32. Screenshot showing networking details.
d. For this service, select the existing load balancer created for the primary service. The routing rules will ensure preview is loaded when required
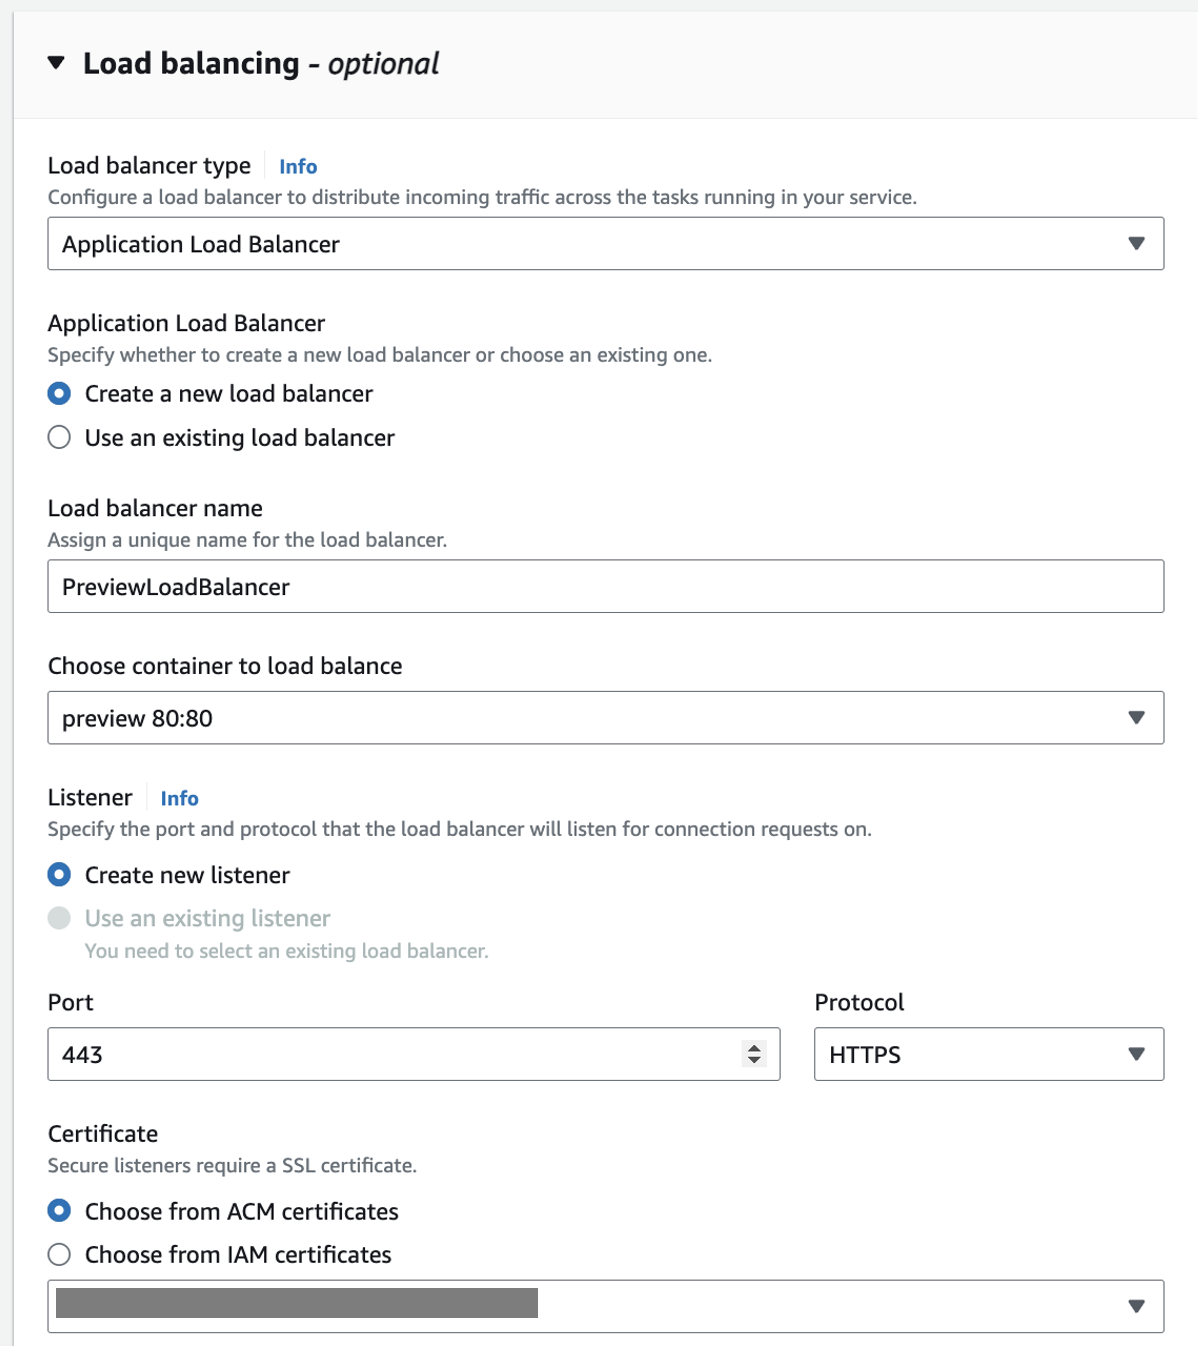
Figure 33. Screenshot showing load balancing details.
e. Once you verify all configurations, select the Create button. It will take some time to deploy all the resources you’ve specified.
f. Create load balancing rules as seen in the image. Priority 1 will point to primary ECS service and the rest will hit preview ECS service
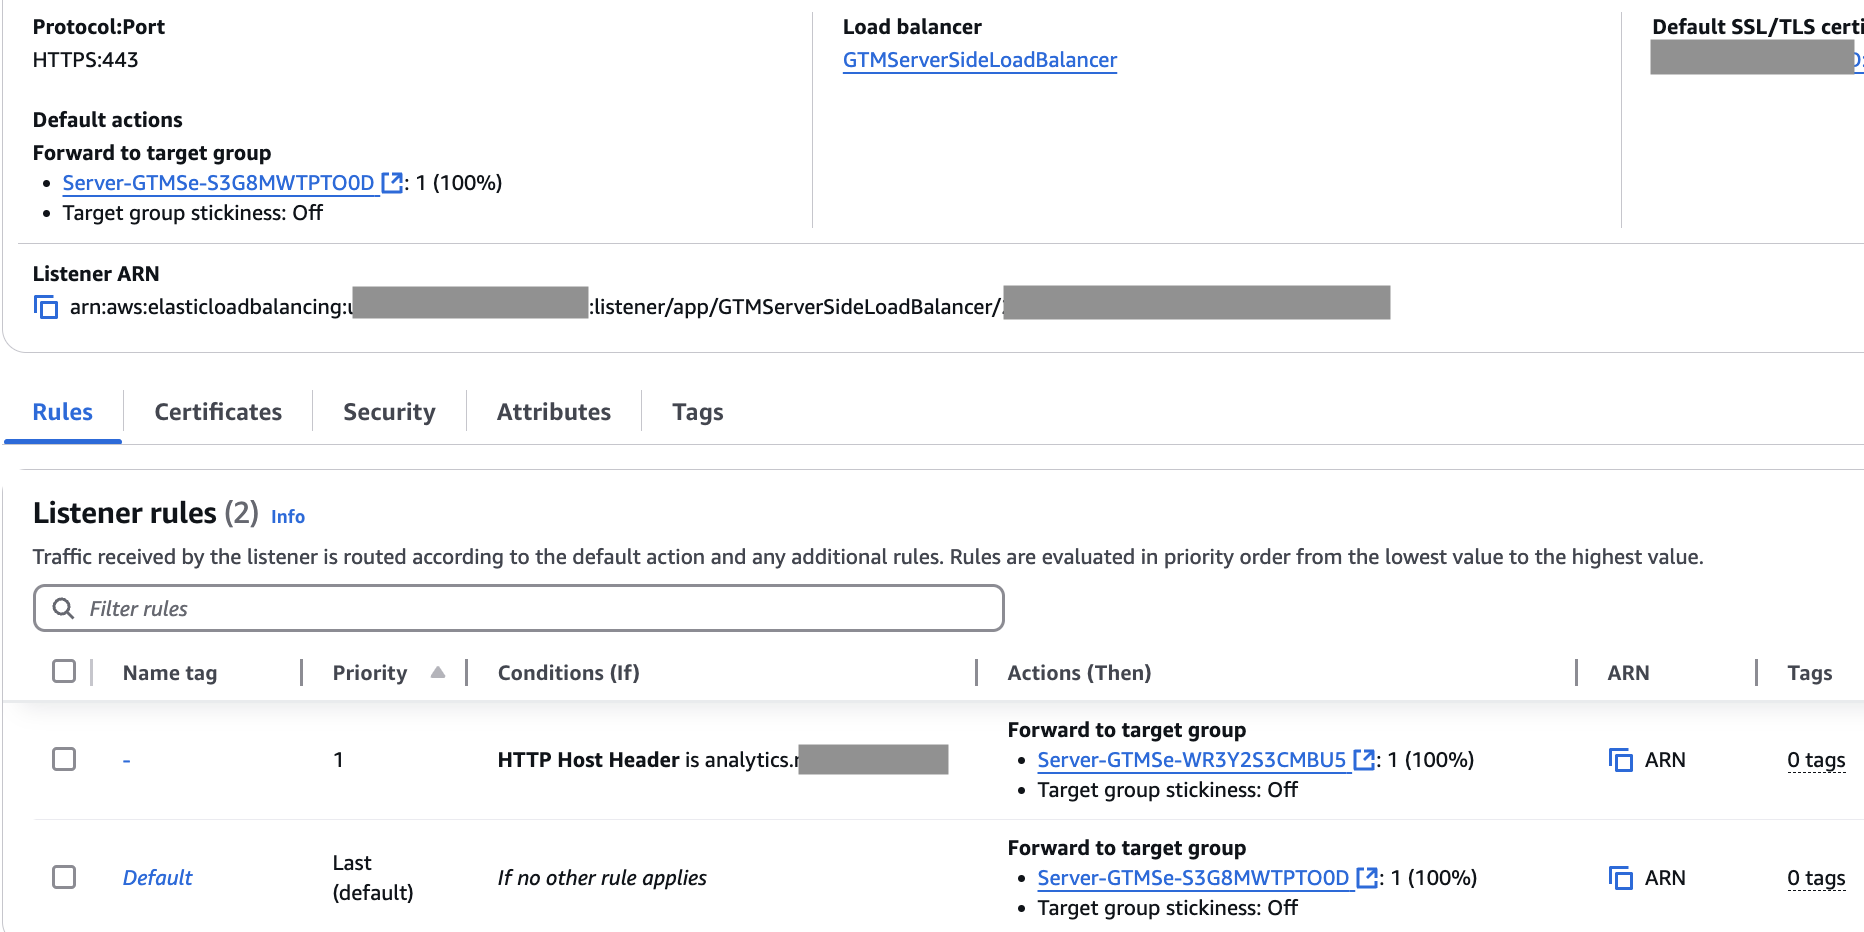
Figure 34. Load balancing rules.
Map DNS to ALB
Once the deployment is complete and your service is up and running, make note of the Load Balancer domain name. This is what you will map your DNS record to. In your DNS service console, add a CNAME record for each domain, mapped to its corresponding Application Load Balancer DNS name as depicted in the Figure below.
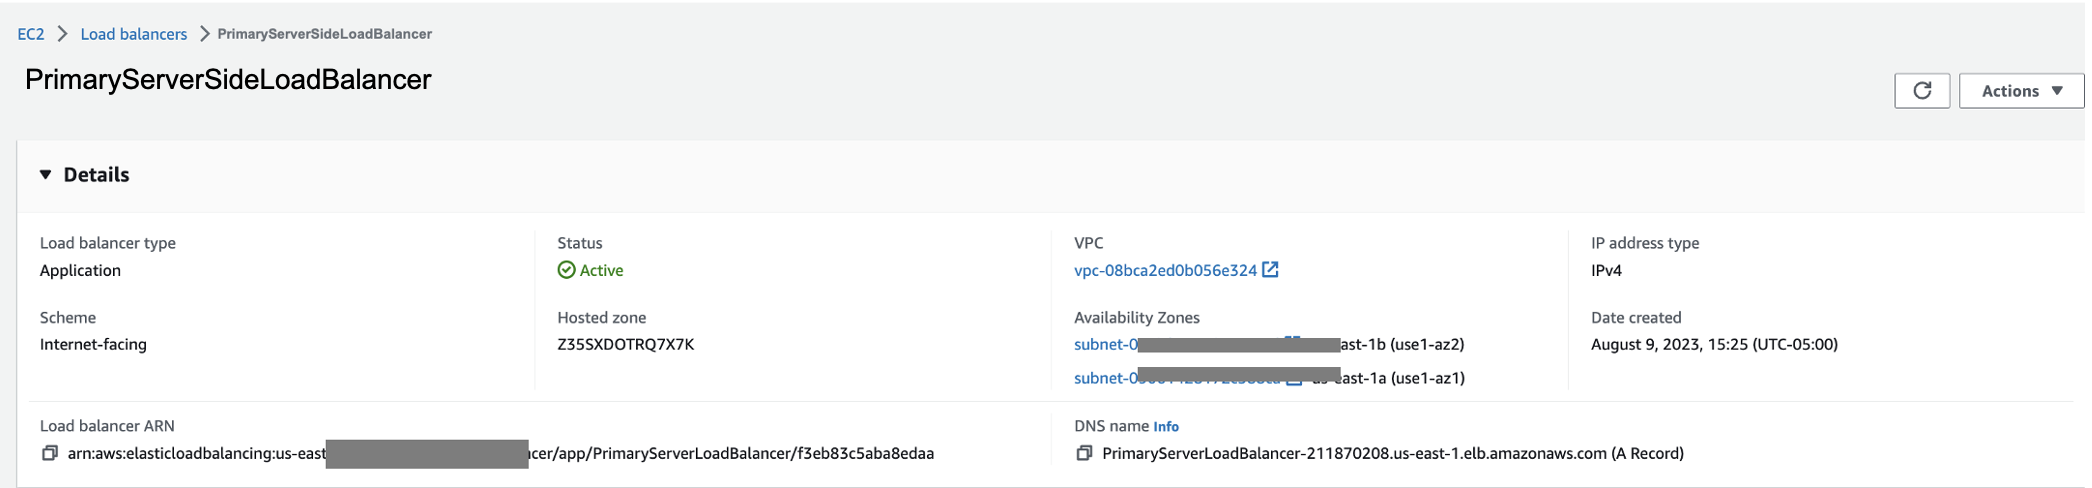
Figure 34. Screenshot showing Primary Server Side Load Balancer details.
It may take some time for your DNS record changes to resolve. You can check by going to the domain name you set up with the healthz path appended, for example: https://analytics.example.com/healthz. There should be an “ok” message in your browser.
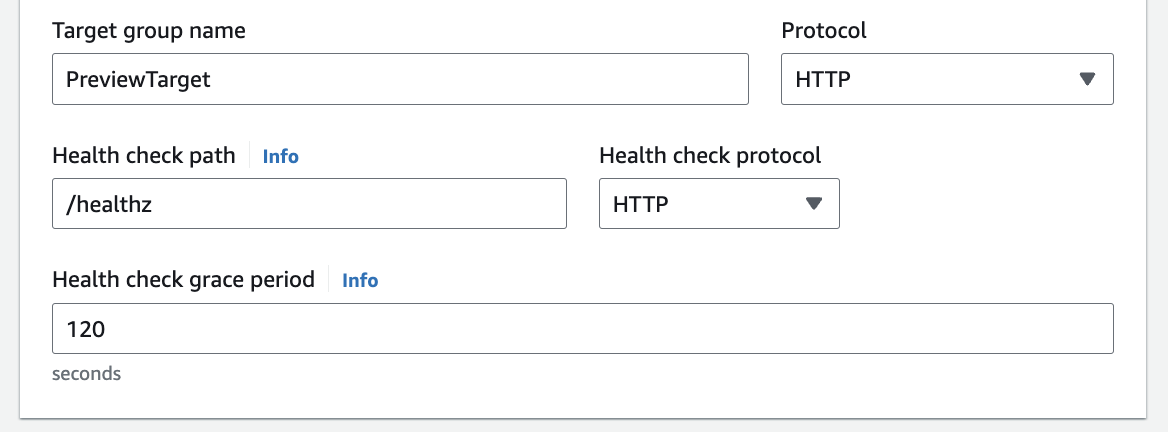
Figure 35. Screenshot showing Target group name.
Google Tag Manager Post Deployment Configuration
Configure the Server Container
After you’ve successfully deployed both Services on ECS, navigate to your Google Tag Manager server-side workspace and follow these final configuration steps:
- In your new Server Container workspace, select Admin, then Container Settings. In the input field labeled Server container URLs, insert the domain name of the Primary Server-Side Container, created in the last section, for example: https://analytics.example.com.
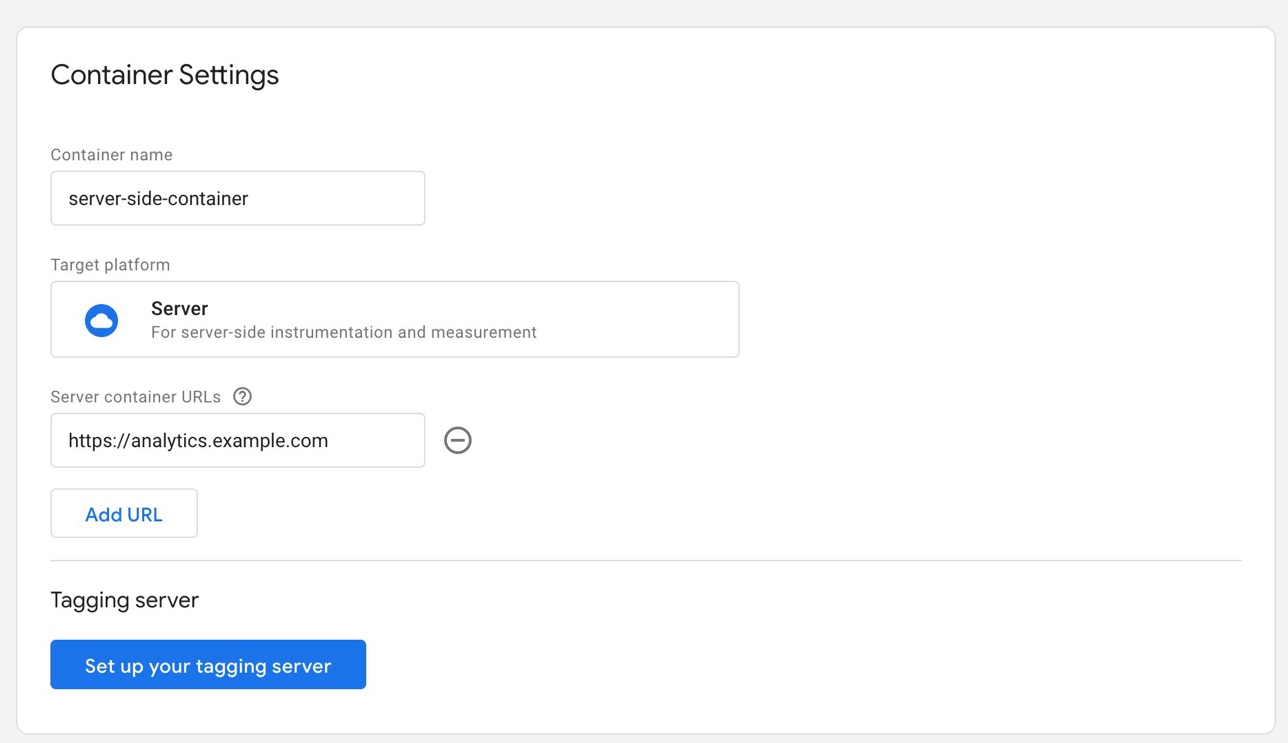
Figure 36. Screenshot showing Container settings.
Configuring the Client
Once saved, navigate back to the Workspace. You will need to set up a client to handle the incoming event stream.
- In the Clients sub-section of the sidebar menu, create a new Client if one isn’t already there. Select Google Analytics: GA4 from the list of options.
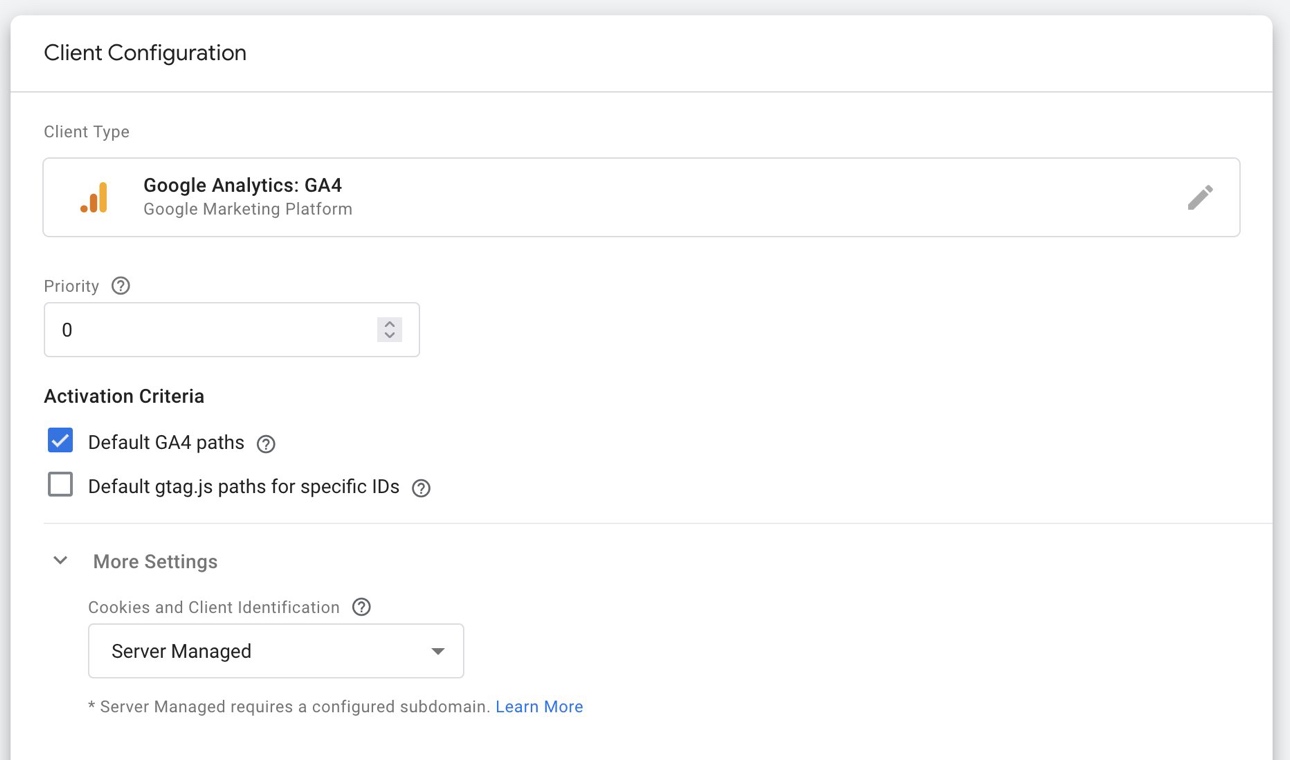
Figure 37. Screenshot showing the client configuration.
- In the configuration options, select Server Managed under Cookies and Client Identification. Next, create a new Google Analytics GA4 Tag from the Tag sub-section of the sidebar menu. Enter your Measurement ID from your Google Analytics Property. You can add additional metadata if desired.
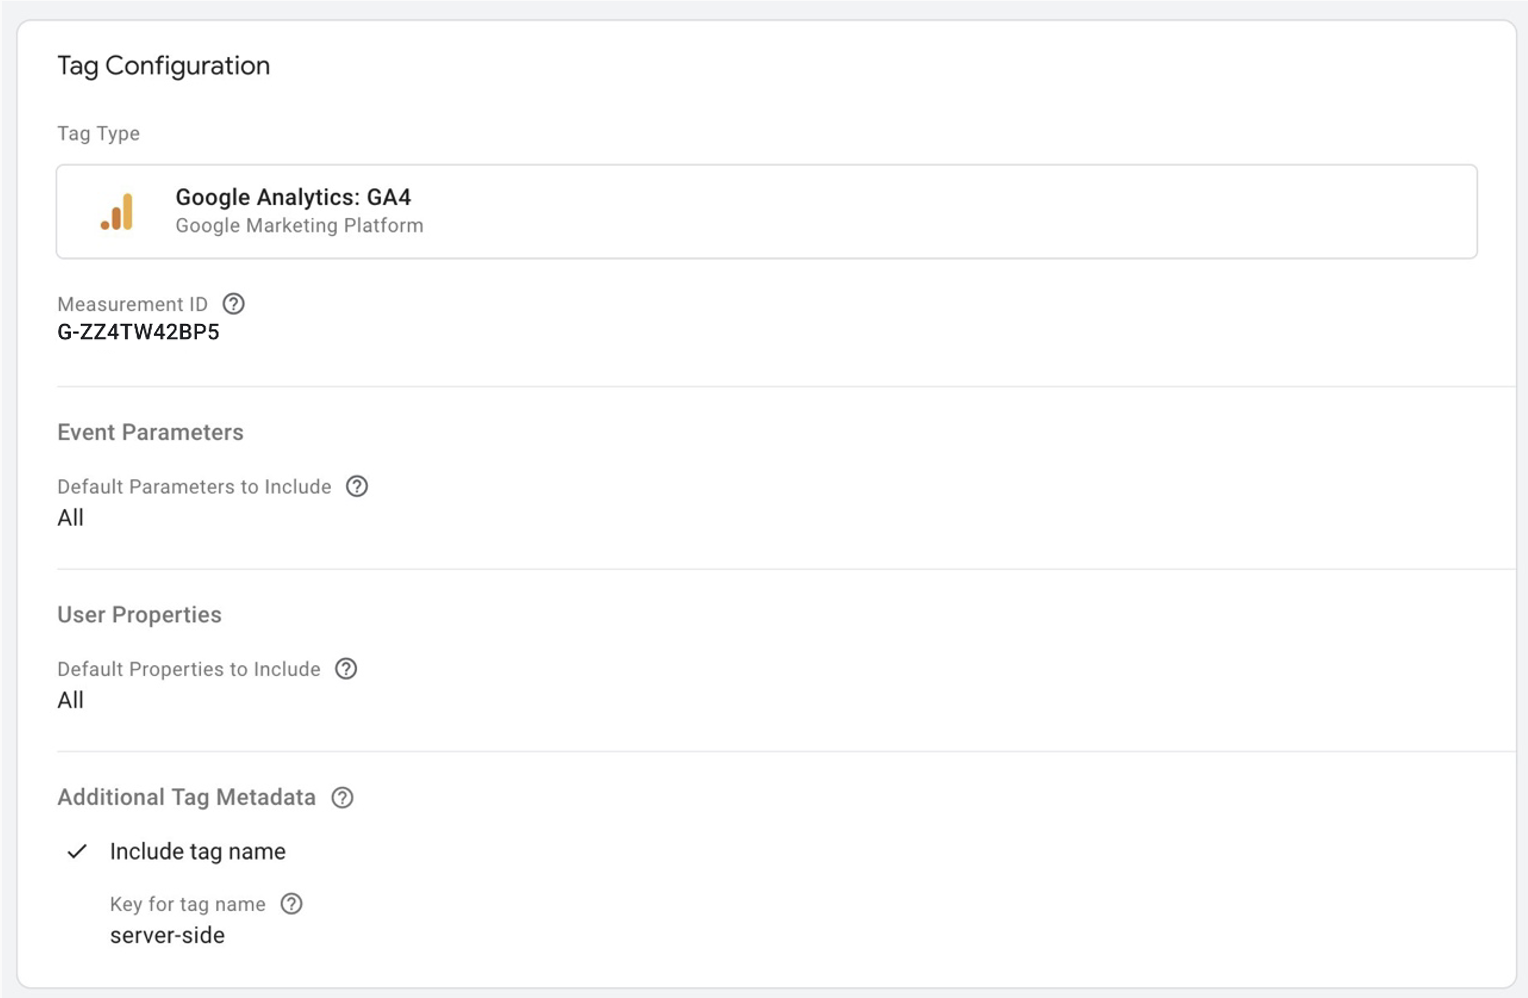
Figure 38. Screenshot showing tag configuration.
- Finally, set up a Trigger for All Pages. This will tell your new Server-Side Container on AWS to send a GA4 Tag back to Google Analytics™️ service whenever a page is loaded on your website.
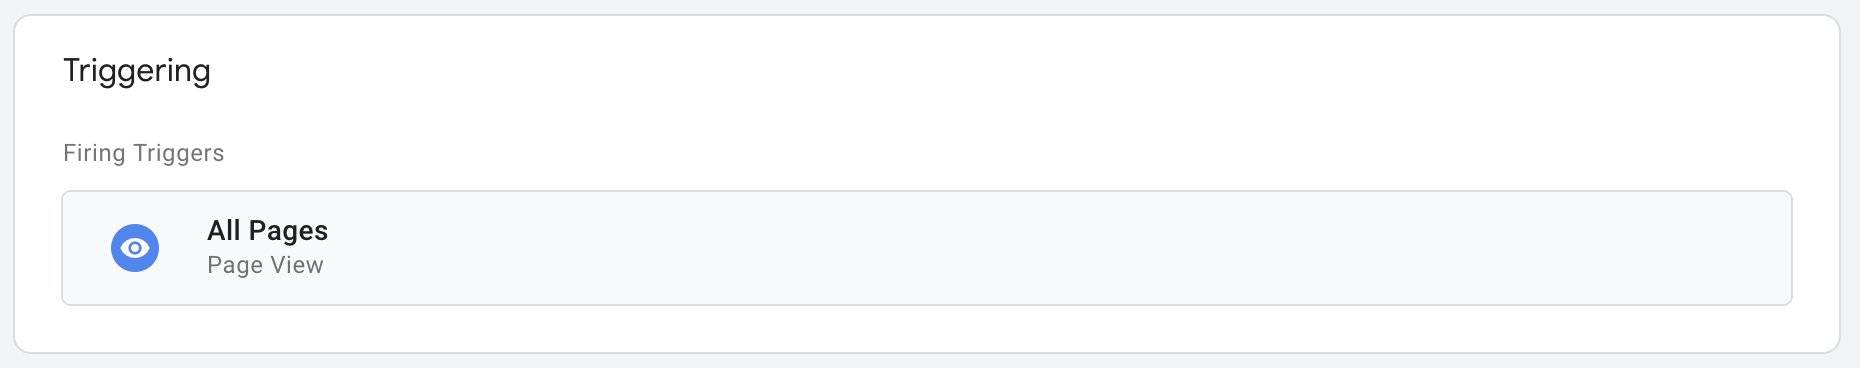
Figure 39. Screenshot showing how to get to the All Pages view.
You should now have a fully functional Server-Side Container running on AWS. Whenever a new page is loaded on your website, the Google Tag Manager Control Plane will send a single Tag to the server running on Amazon ECS. From here, Google Tag Manager is now configured to send Tag data back to Google Analytics™️ service. You can add additional tags to send data to other third-party integrations per your business needs.
The next section explains how to take advantage of this new Server-Side architecture and capture that same hit-level data in your AWS account.
Data Collection Setup
This section focuses on collecting streaming data from previous steps into Amazon S3 by using Amazon API Gateway and Amazon Kinesis. First, you will create and deploy a REST API in Amazon API Gateway that will integrate with Amazon Kinesis Data Streams to capture and store web analytics stream for further processing. The data collector service created earlier in this implementation guide will post requests to an internal, private Amazon API Gateway over a VPC interface endpoint.
Create Amazon Kinesis Data Stream
Follow these steps to create a data stream using the console:
Sign in to the AWS Management Console and open the Kinesis console.
Choose Create data stream.
On the Create Kinesis stream page, enter a name for your data stream and choose On-demand capacity mode. Then, choose Create Kinesis stream.
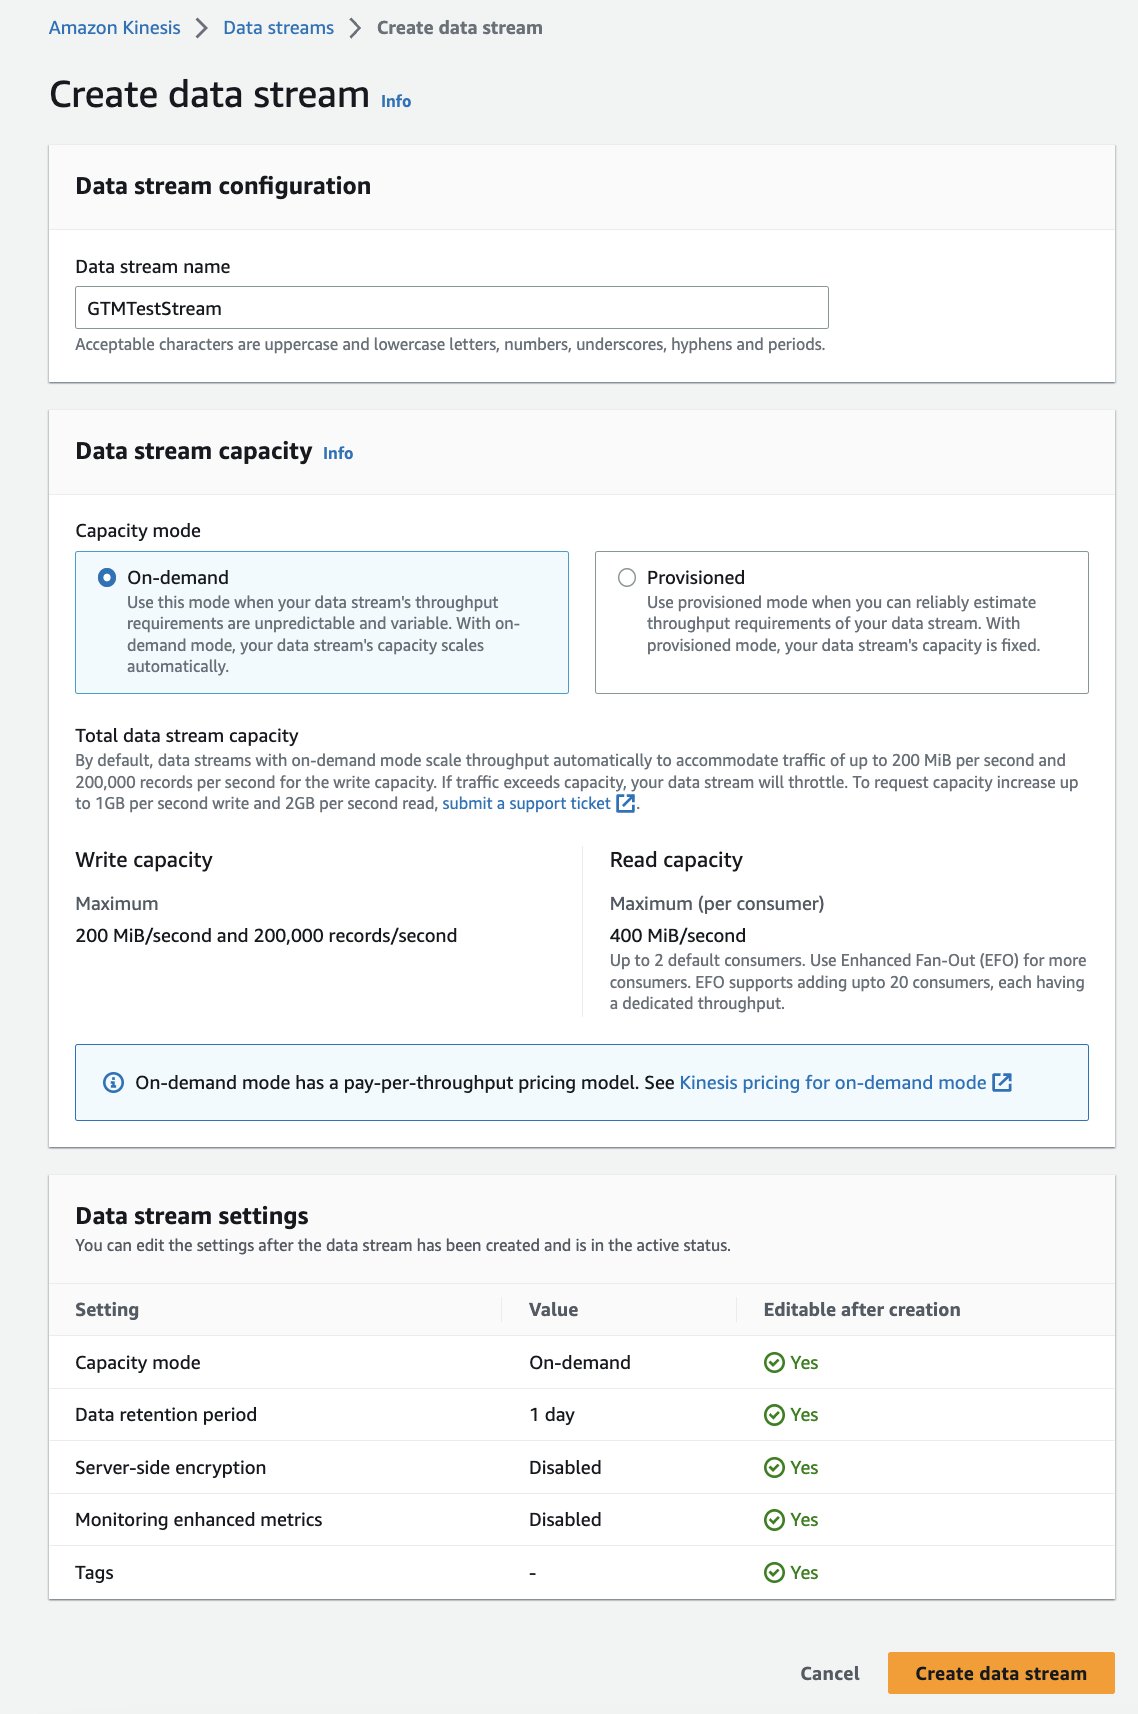
Figure 45. Screenshot showing how to create the data stream.
At this point, you have the Kinesis Data Stream created to receive the data stream. Next, you will configure ingestion of the data stream to Amazon S3 using Amazon Kinesis Data Firehose for analysis.
Writing to Amazon Kinesis Data Firehose from Kinesis Data Streams
Follow the steps below to configure Amazon Kinesis Data Firehose.
Sign in to the AWS Management Console and open the Kinesis Data Firehose console.
Choose Create Delivery Stream.
On the Create delivery stream page, choose source as Amazon Kinesis Data stream and destination as Amazon S3.
a. Browse Source settings to select your Kinesis Data Stream from the last section.
b. Provide a delivery stream name.
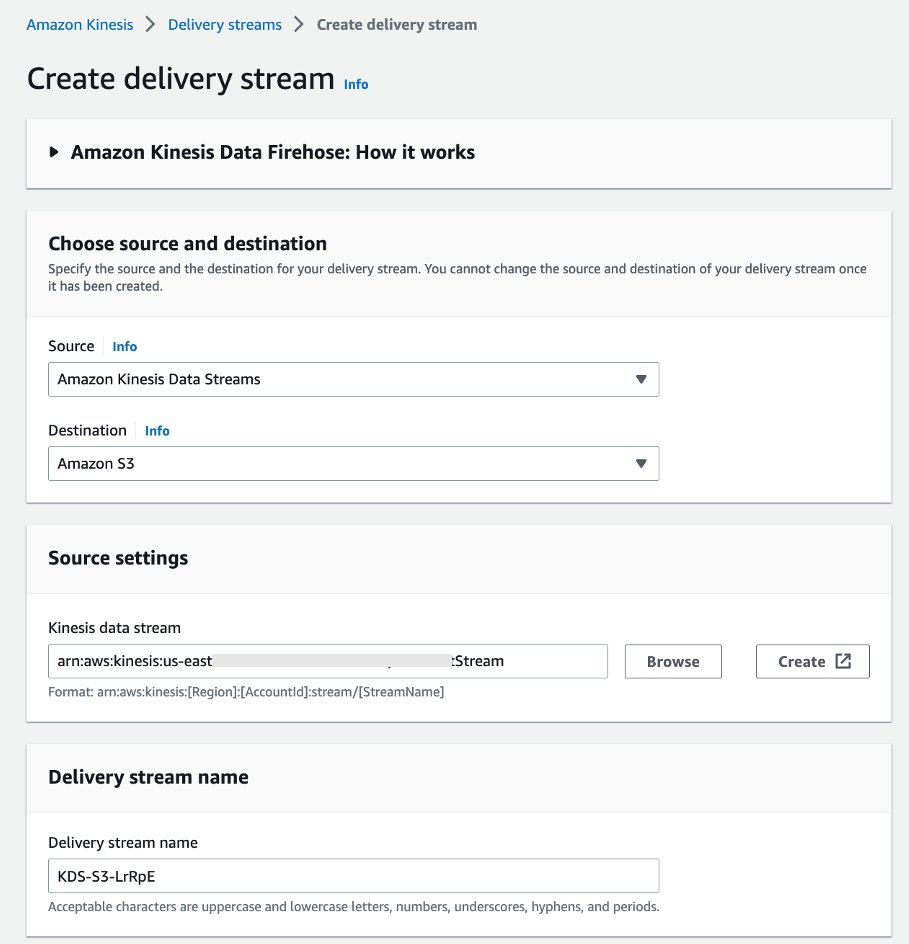
Figure 46. Screenshot showing how to create the delivery stream.
For this Guidance, do not select Transform and convert records.
Browse the S3 bucket to select destination settings. Leave dynamic partitioning as Not enabled and select Create delivery stream.
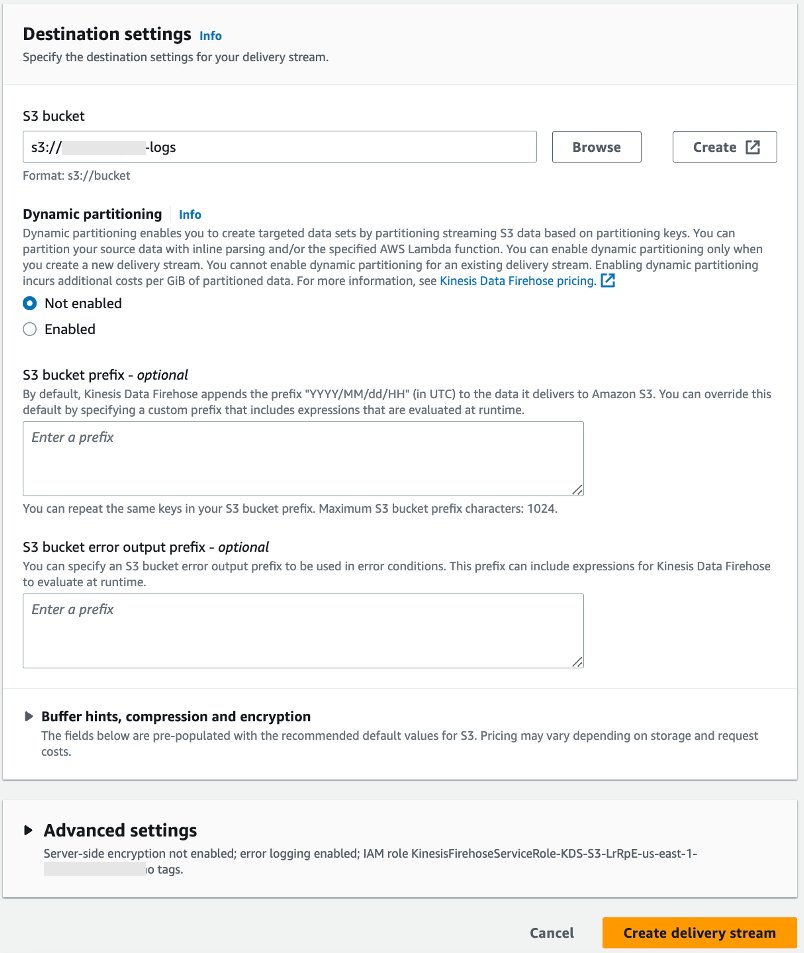
Figure 47. Screenshot showing destination settings.
At this point, you have configured Kinesis Data Firehose to deliver date partitioned data to an S3 bucket in near real time. The partitioning is driven by the buffer size and buffer interval value configured in the delivery stream.
Creating the API
In this section, you will create and configure a REST API with an integration of AWS type to access Kinesis.
Follow the steps below to create this API in API Gateway:
Sign in to the API Gateway console.
Select Create API. Select Build from the REST API section. On the next page, choose REST protocol and create a New API. Choose a friendly name and description for your API.
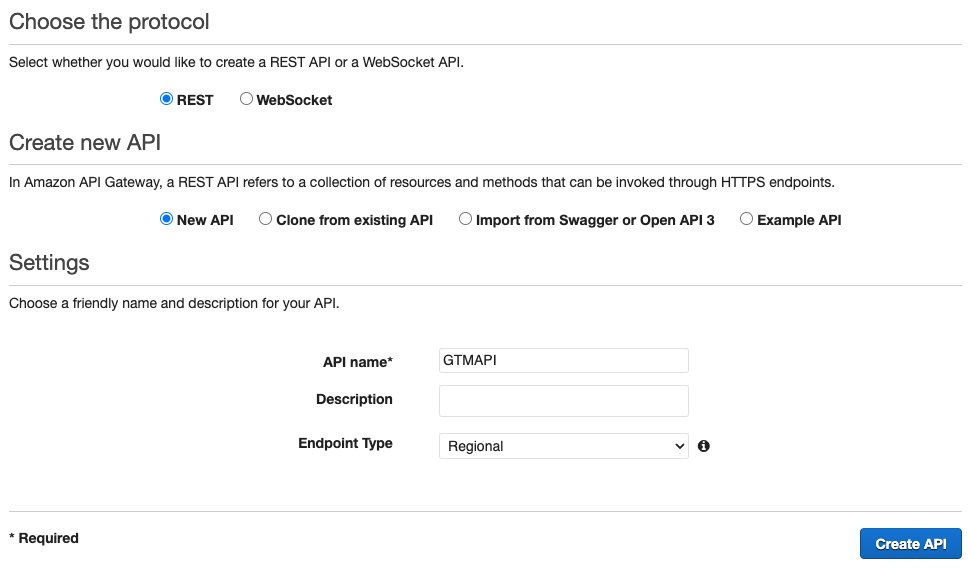
Figure 40. Screenshot showing how to choose a protocol.
- This will create an empty API with the resources tree showing the root resource (/).
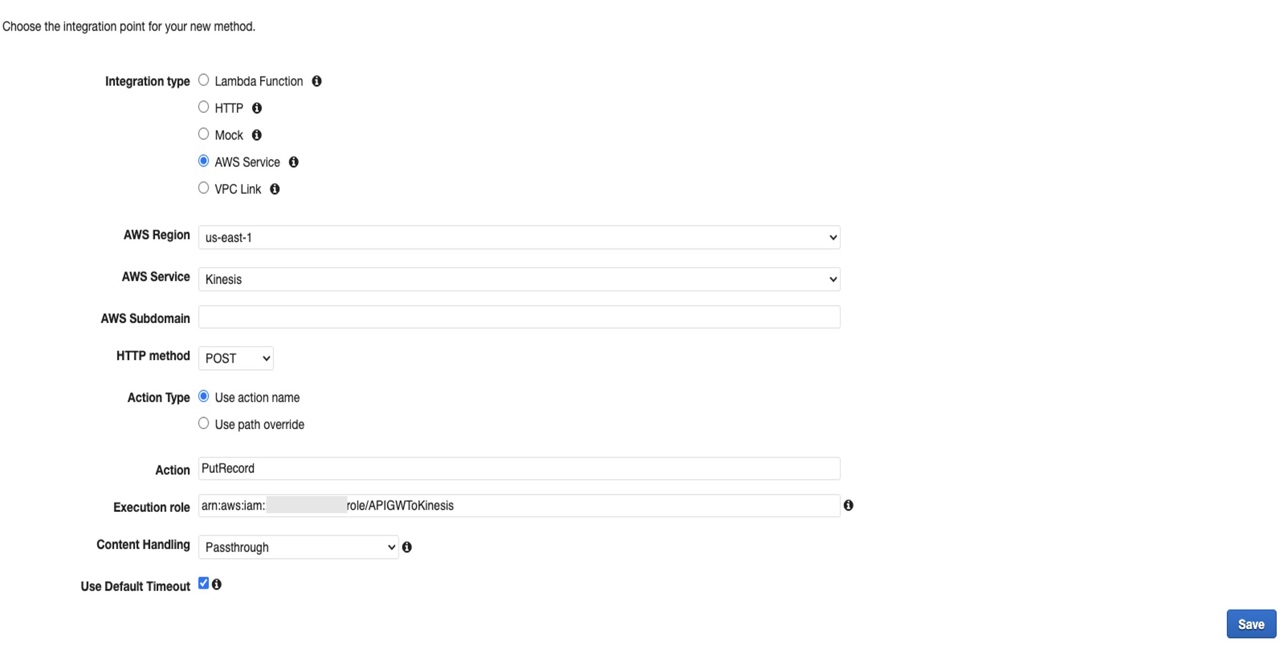
Figure 41. Screenshot showing the integration point for your selected method.
- Select the root, choose Actions, and then choose Create Resource.
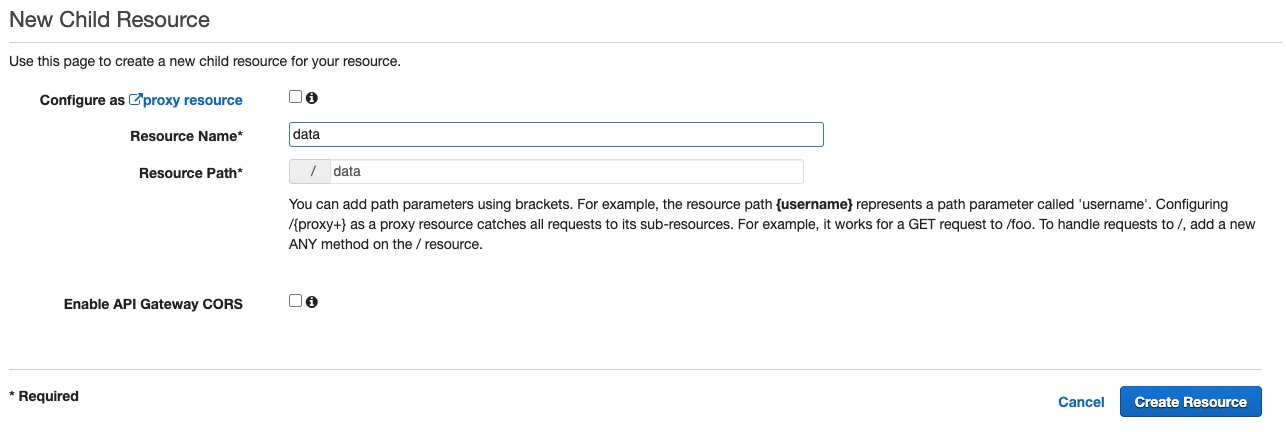
Figure 42. Screenshot showing the New Child Resource.
Next, follow these steps:
a. Choose Actions and then Create Method. Select POST.
b. In the method’s Setup pane, select Integration type as AWS Service.
c. Select your Region.
d. Select AWS Service as Kinesis.
e. Select Http method as POST.
f. Select Action as PutRecord.
g. Select an Execution Role and select Save.
- After Step 5, you can view the details of method within the method execution pane. Method Request and Method Response are the API’s frontend whereas Integration Request and Integration Response are the API’s interface with the backend service. In this case, the backend service is Kinesis.
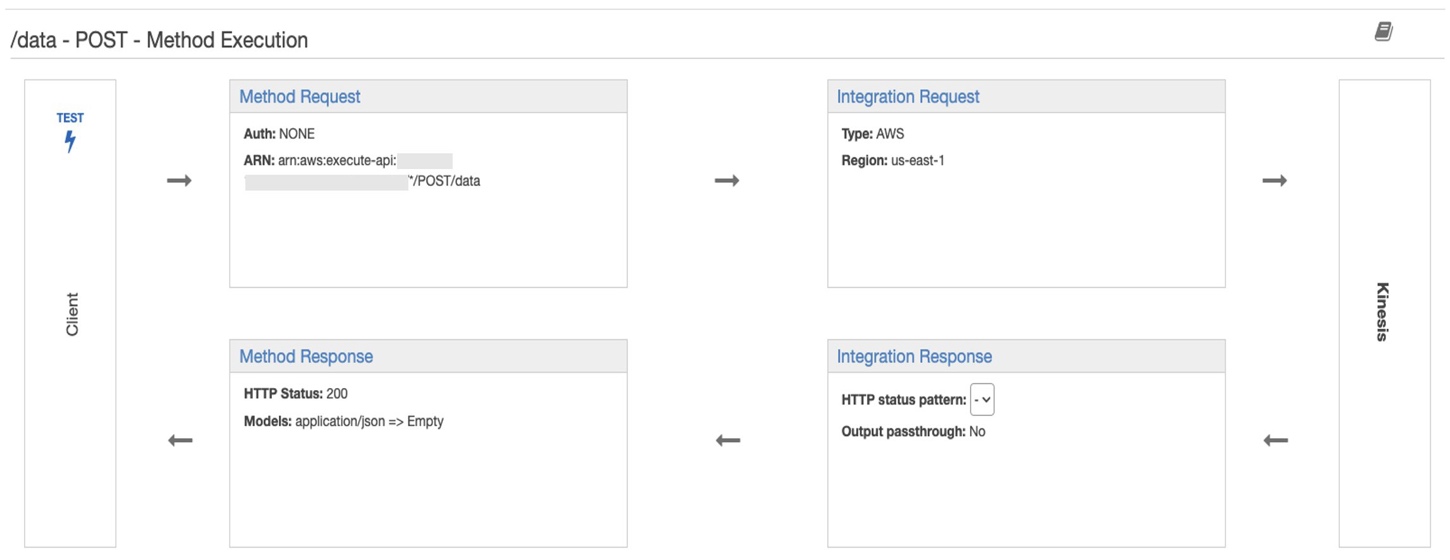
Figure 43. Screenshot showing the method execution.
- Edit the api and edit the Integration request option. Scroll down to the Mapping template section and add a new mapping template and insert below template. Insert the Kinesis stream name from your stack in the place holder
{
 "StreamName" :"<>",
 "PartitionKey" : $input.json('$.ga_session_id'),
 "Data" : "$util.base64Encode($input.json('$'))"
}
Once you have created the API, the next step is to deploy this API.
Deploying the API
From the Amazon API Gateway console, choose Actions, Deploy API. This will prompt you to create a new stage. You can use prod for the stage name.
In the Actions dropdown list, select Deploy API.
Select [New Stage] in the Deployment stage dropdown list.
Enter prod for the Stage Name.
Choose Deploy.
Note the Invoke URL. Test the API.
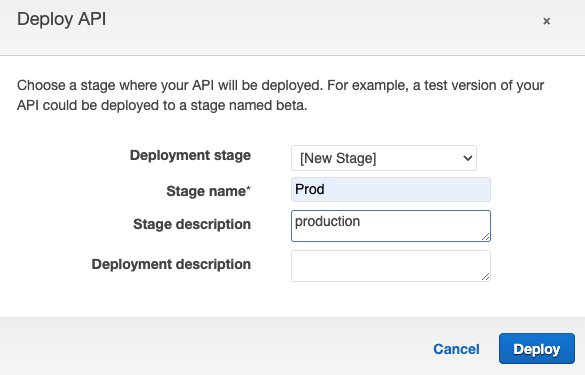
Figure 44. Screenshot showing how to deploy the API.
After the API is deployed, create an Amazon Kinesis Data steam to capture and store web analytics data at scale.
Data Analysis Setup
In this section, you will set up analytics flow using AWS Glue and Amazon Athena so you can gather insights from the captured web-analytics data stored in the S3 bucket.
Data Catalog
You will catalog the transformed web analytics data in AWS Data Catalog which will store metadata about data files in the S3 bucket.
Create AWS Glue Data Catalog database
Register the click stream data in Amazon S3 with AWS Glue Data Catalog using the following steps:
Sign in to AWS Console and navigate to the AWS Glue Data Catalog.
Select Databases under the Data catalog section in the left navigation menu.
Select Add database and provide a name.
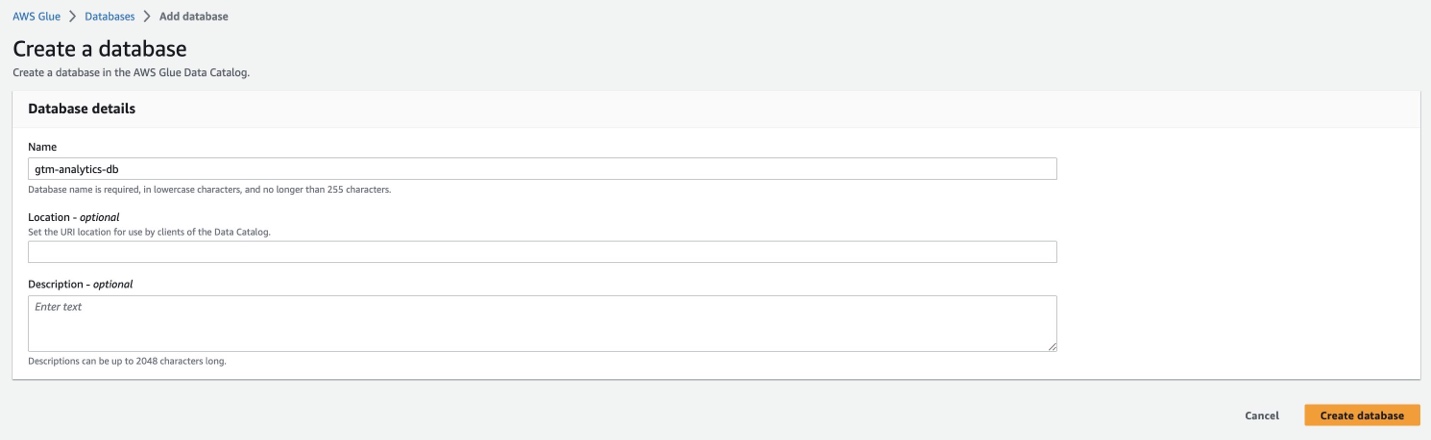
Figure 48. Screenshot showing how to create a database.
Create AWS Glue Crawler
Use AWS Glue Crawler to populate the AWS Glue Data Catalog by crawling the clickstream data in the Amazon S3 bucket. Upon completion, AWS Glue Crawler will create respective tables in your data catalog.
Sign in to the AWS Console and navigate to AWS Glue Data Catalog AWS Glue Data Catalog.
Select Crawlers under the Data catalog section in the left panel.
Select Create crawler.
Provide a unique crawler name and add appropriate tags.
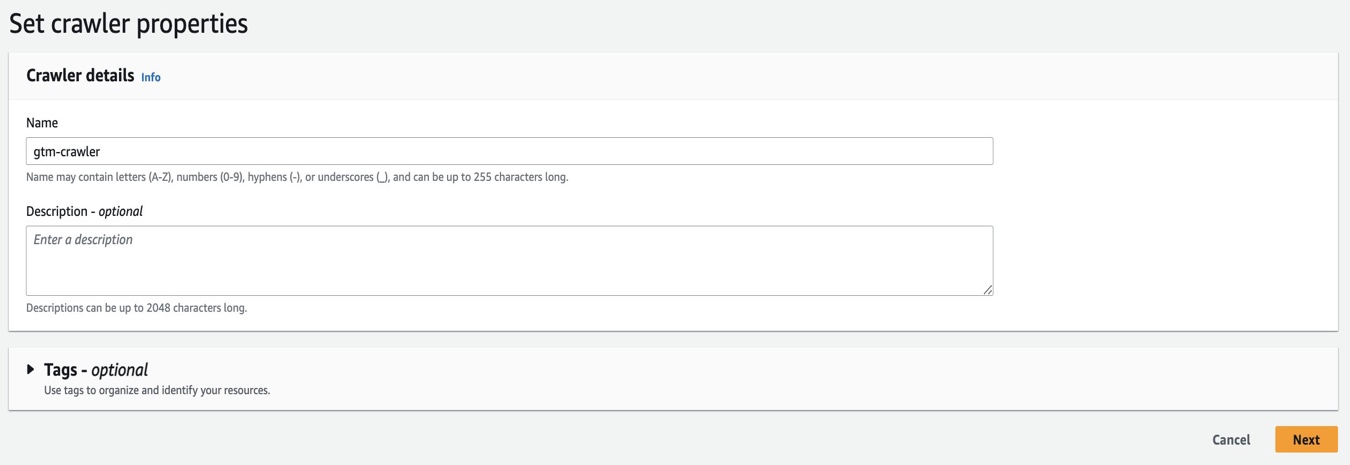
Figure 49. Screenshot showing how to set crawler properties.
- Add a data store. Enter S3 and provide output bucket location.
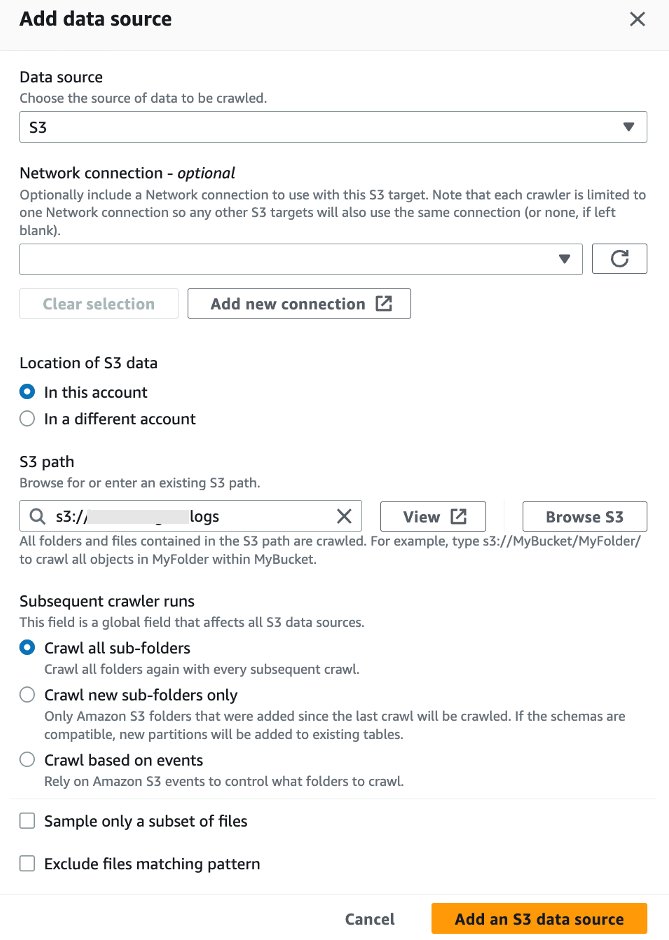
Figure 50. Screenshot showing how to add an S3 data source.
- Create a new IAM role. On the next screen, set output and scheduling.
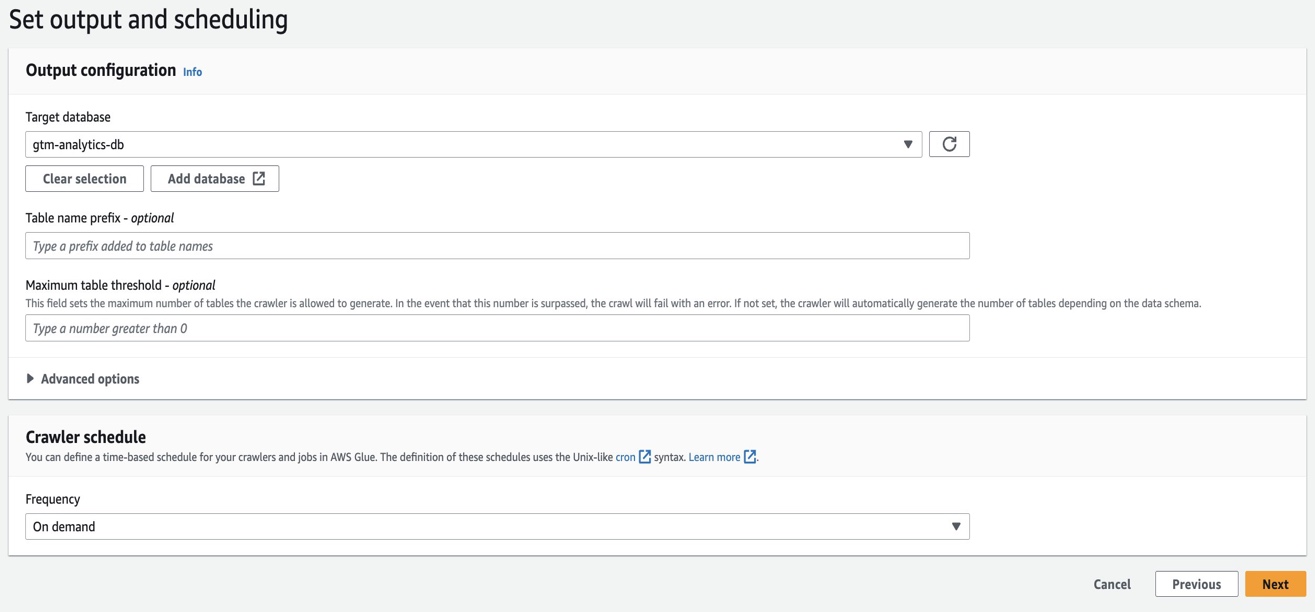
Figure 51. Screenshot showing how to set up output and scheduling.
- Review and create the crawler.
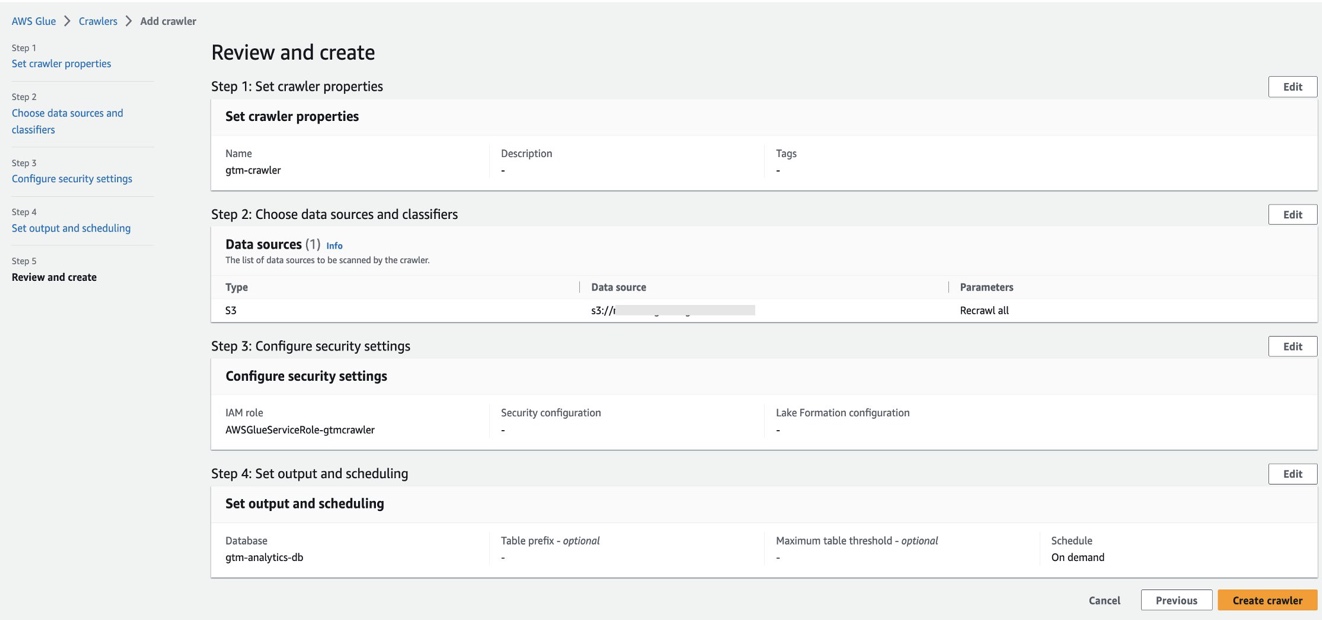
Figure 52. Screenshot showing how to review and create the crawler.
Run AWS Glue Crawler
- Select crawler from the list and select Run to populate AWS Glue Data Catalog with the table.
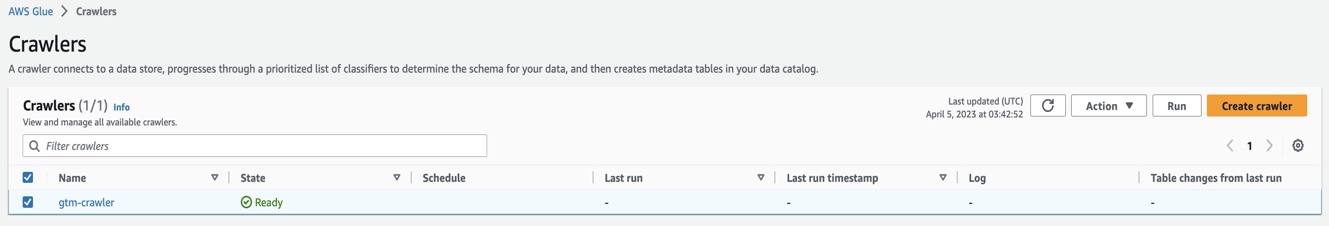
Figure 53. Screenshot showing crawlers.
- Once the crawler stops, verify that the table is populated.
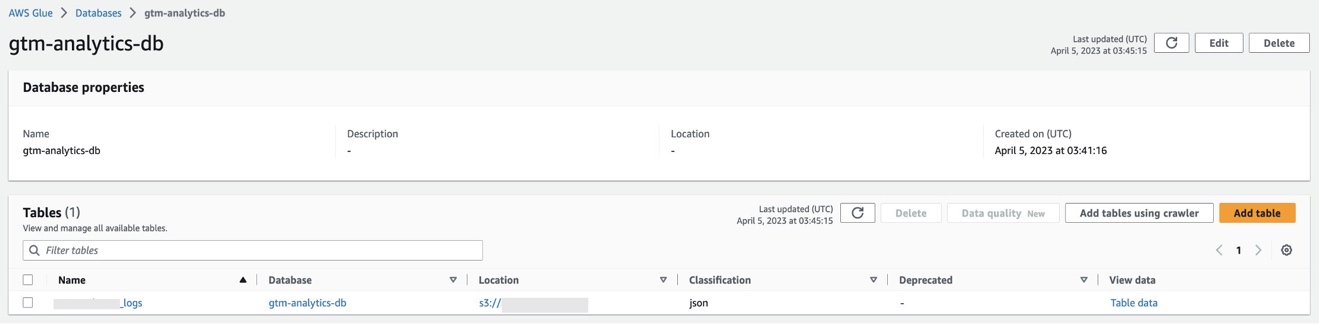
Figure 54. Screenshot showing database properties.
At this point, you have the data catalog ready for analytics tools like Amazon Athena to access and analyze the captured web analytics data.
Query Data Catalog in Athena
Open the Athena console.
If this is your first time visiting the Athena console in your current AWS Region, choose Explore the query editor to open the query editor. Otherwise, Athena will open in the query editor.
- Choose Edit Settings to set up a query result location in Amazon S3.
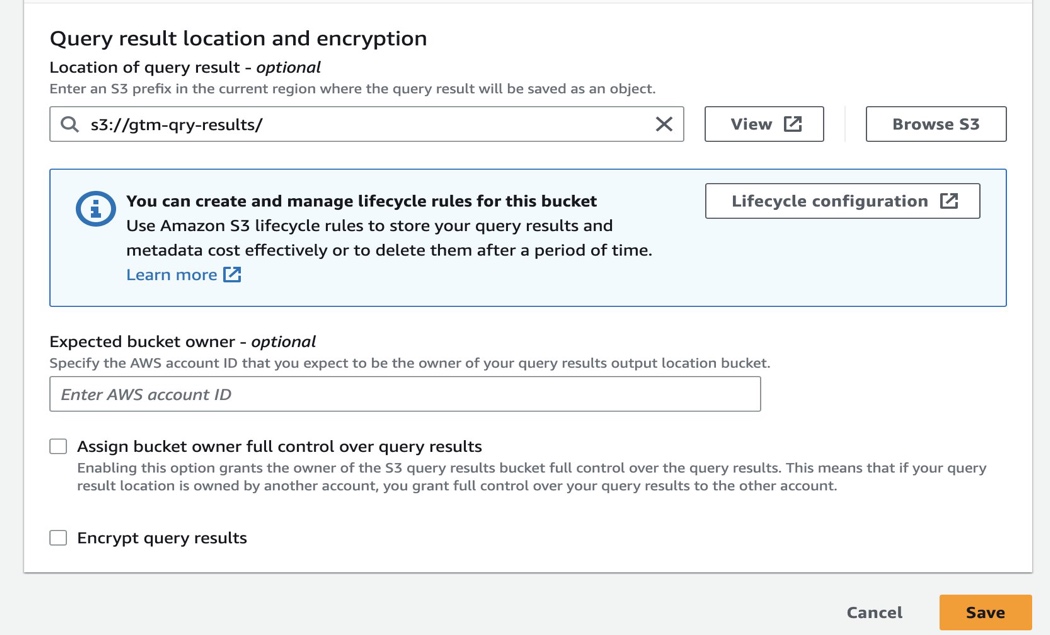
Figure 55. Screenshot showing the query result location and encryption.
- Navigate to Query editor. Under Data source, select AwsDataCatalog. Under Database, select the AWS Glue Catalog database you created in previous steps. Use the editor on the right pane to start analyzing the captured and transformed web analytics data.
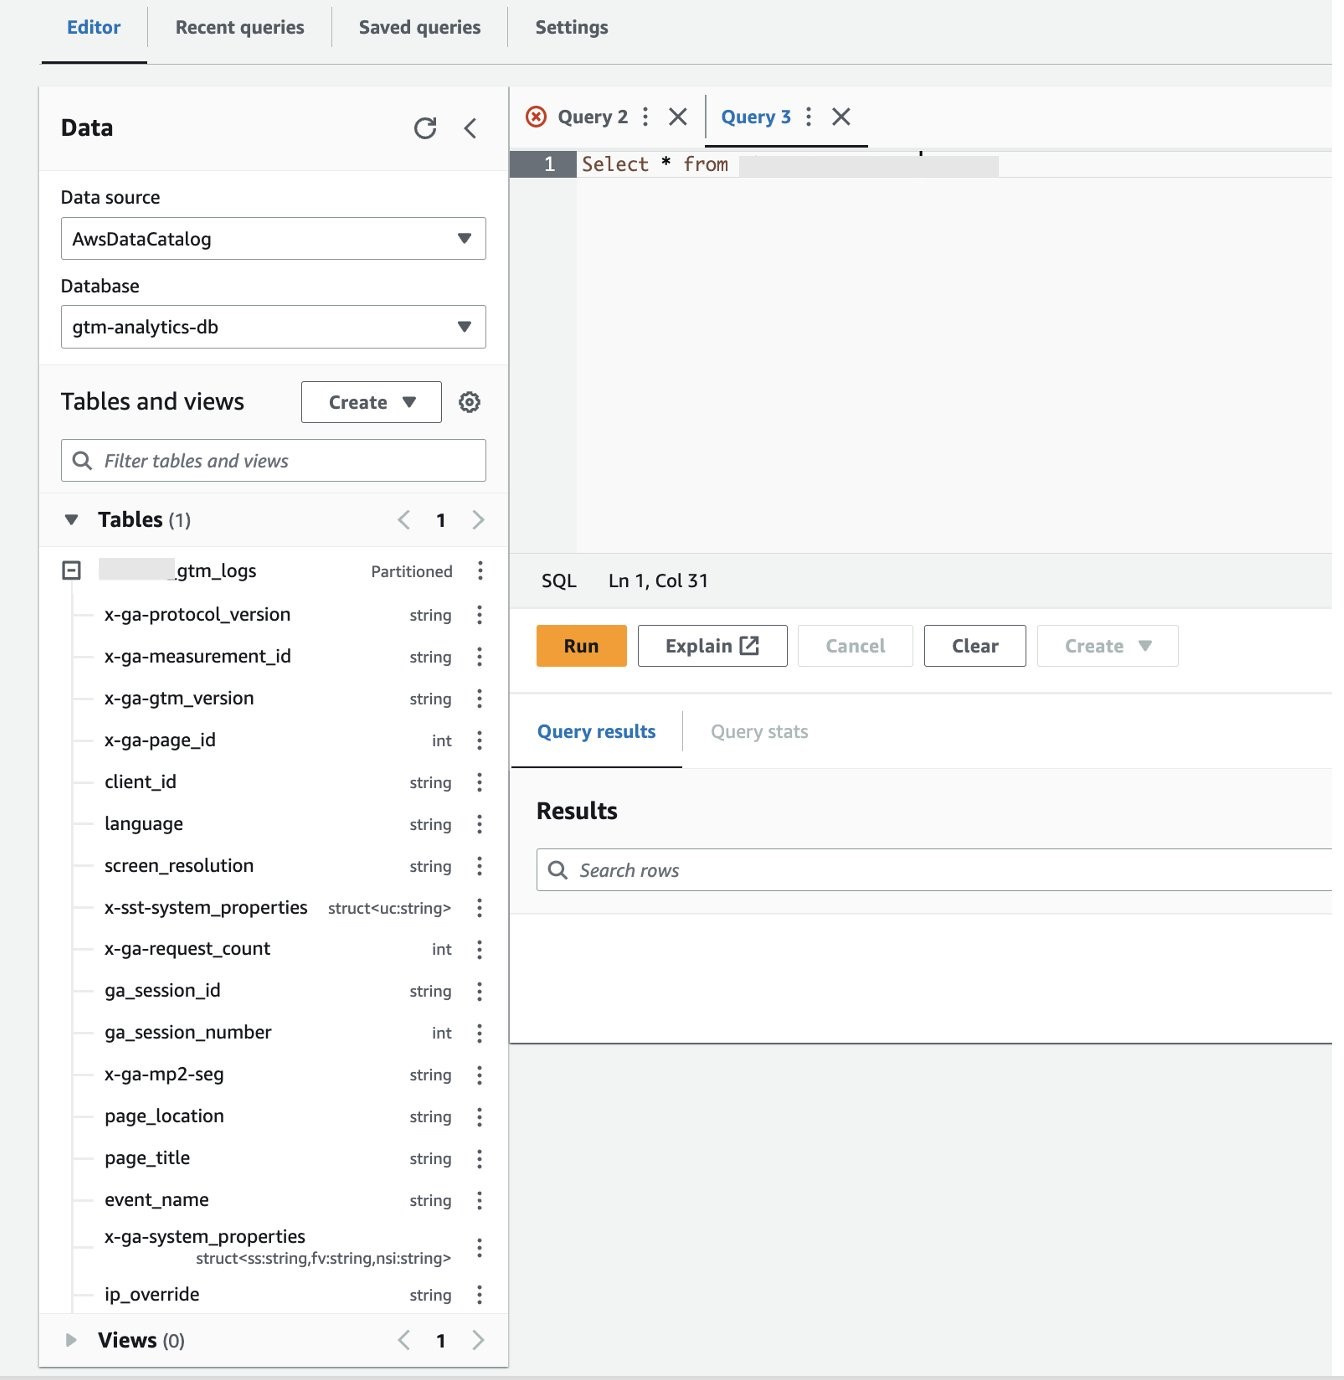
Figure 56. Screenshot showing query editor with data source.
- Additionally, you can set up Amazon QuickSight analysis and dashboards to visualize the insights captured from the web analytics data. Follow this documentation to build a QuickSight dashboard on this data.
At this point, you have completed all the steps needed to:
Capture, transform, and load website event streaming data generated by Google Tag Manager into Amazon S3.
Set up AWS Glue Data Catalog and Athena to access the data for analysis.
Create data visualizations using QuickSight.
Near-real time analytics latency, determined by buffer size and interval set up in Kinesis Data Firehose delivery streams.
The next sections explains how you can ingest and store the streaming web analytics data directly from Kinesis Data Stream into Amazon OpenSearch Service to create a near real-time dashboard.
Building Interactive Dashboards using Amazon OpenSearch
Follow this documentation to create an AWS Lambda function and start streaming data from Kinesis Data Streams into Amazon OpenSearch Service.
Consider the following while setting up your dashboard:
As part of the Lambda code setup, you can additionally specify the batch size of the records from the Kinesis data stream that you want to send to the Lambda function.
You can use the OpenSearch Service domain for search and visualization.
By default, an OpenSearch Service domain within VPC cannot be accessed from the internet. You can set up a highly available proxy cluster (for example, Nginx) which allows you to access the OpenSearch Dashboards from the internet.
Clean Up Resources
Delete your AWS Glue Database and Connection
Open the AWS Glue console.
Choose Databases from the left navigation bar. Check the checkbox next to Default to select it. Choose Action, Delete Database. Confirm your selection.
Choose Connections from the left navigation bar. Check the checkbox next to the created connection to select it. Choose Action, Delete Connection. Confirm your selection.
Delete your AWS Glue Crawler
Open the AWS Glue console.
Choose Crawlers from the left navigation bar.
Select your AWS Glue Crawler and Select Action, Delete Crawler. Confirm again to delete the AWS Glue Crawler.
Delete your IAM Roles and Policies
Open the IAM console.
Choose Roles from the left navigation bar.
Use the search bar to search for the created role.
Choose the created role. Choose Delete Role. Confirm the deletion.
Delete Amazon S3 Object and Bucket
Open the Amazon S3 console.
Choose your bucket.
Choose Delete and then enter the bucket name to confirm deletion.
Clean up Kinesis Data Streams Resources
Open the Kinesis Data Streams console.
Select your Kinesis Data Stream, and choose Actions, Delete.
Delete your Amazon Kinesis Data Firehose Delivery Streams
- Go to the AWS console and open Amazon Kinesis. Click on Data Firehose from the left sidebar. Select Delivery streams and select Delete. This will open a dialog. To confirm deletion, type the delivery stream name in the field and then choose Delete.
Deregister an Amazon ECS Task Definition
Open the Amazon ECS classic console.
From the navigation bar, choose the Region that contains your task definition.
In the navigation pane, choose task definitions.
On the task definitions page, choose the task definition family that contains one or more revisions that you want to deregister.
On the task definition Name page, select the box to the left of each task definition revision that you want to deregister.
Choose Actions, Deregister.
Verify the information in the Deregister task definition window, and then choose Deregister to finish.
(Optional) To deregister the task definition family, repeat the above steps for each ACTIVE revision.
Delete ECS Cluster
Open the Amazon ECS classic console here.
From the navigation bar, select the Region to use.
In the navigation pane, choose Clusters.
On the Clusters page, select the cluster to delete.
In the upper-right of the page, choose Delete Cluster. This will bring up a confirmation prompt.
In the confirmation box, enter delete me.
Delete Load Balancer
If you have a DNS record for your domain that points to your load balancer, point it to a new location and wait for the DNS change to take effect before deleting your load balancer.
Open the Amazon EC2 console.
On the navigation pane, choose Load Balancers.
Select the load balancer, and then choose Actions, Delete load balancer.
When prompted for confirmation, enter confirm and then choose Delete.
Delete API Gateway Rest API
Go to AWS Console and open API Gateway. Select your REST API and delete it by selecting Actions, Delete.
Delete your VPC
Open the Amazon VPC console.
In the navigation pane, choose Your VPCs.
Select the VPC to delete and choose Actions, Delete VPC. If there are resources in the VPC, you must delete or terminate them before you can delete the VPC.
Delete your Lambda Function
Open the AWS Lambda console.
Select your Lambda function and then select Actions, Delete.
On the Dialog, enter delete in the field to confirm deletion.
Google Tag Manager Cleanup
Navigate Google Analytics and select the gear icon on the bottom left of the interface to load the Admin menu. Select your property, and then select property settings. Select Move to Bin on the top right corner. Once you confirm, it will be scheduled for deletion.
Navigate Google Tag Manager. On the Tag Manager Accounts screen, select the Google tags tab. Select the Google tag you’d like to delete. Go to the Admin tab. In the Manage Google tag section, select Delete from the menu that shows three dots.
Navigate to Google Tag Manager. Select the three dots on the right side of the container name and select Container Settings. Choose Delete from the menu showing the three dots on the top right.
Navigate Google Tag Manager. On the Accounts screen, select the three dots next to account name. Select Account Settings. Choose Delete from the menu showing the three dots on the top right corner.
Conclusion
This implementation guide has demonstrated how to set up Google Tag Manager to stream website interaction data in to your AWS environment and enable data analytics.
You can use the website interaction data captured in AWS to drive multiple business outcomes, including the following:
Enrich and build a Customer 360 profile with the customer behavior and interaction data for improved segmentation and targeting.
Use Amazon Personalize to deliver personalized customer experiences, acquire and retain customers, increase engagement, drive efficiencies, and improve site search relevancy.
Achieve privacy-safe data collaboration using AWS Clean Rooms.
Use Amazon SageMaker to build machine learning (ML) models and activate analytics and measurement use cases. This provides better insights in to customer behavior, campaign effectiveness, and attribution.
The benefits of this Guidance include the following:
Deliver web, mobile, and server-sent data to existing platforms as normal, including Google Analytics™️ service, and simultaneously emit event data to AWS analytics services.
Engineering teams can reduce webpage load times by moving all third-party and custom JavaScript tags out of the website and onto the server-side container.
Customers can improve cross-domain tracking by using both client-side and server-side first-party cookies.
Data teams can maintain full control over how event and user data is shaped and manage where the data is sent. These teams can also audit hit-level data as emitted from their source systems to reduce fraud and optimize channel spend.
Establish restrictive consent security policies and improved user privacy with a browser that no longer needs to communicate directly with vendor domains.
Requires no changes to front-end code.
Contributors
The following individuals contributed to this solution: Micah Walter, Harmeet Nandrey, Prashant Yadav, Ranjith Krishnamoorthy