Guidance for Building Queries in AWS Clean Rooms
Summary: This Guidance aims to help users getting started with AWS Clean Rooms collaboration. The reference architecture first illustrates how users can set up an AWS Data Clean Rooms data collaboration and prepare data. Then it illustrates how to use Amazon Athena and Amazon QuickSight for further analysis and visualization of the results produced as output of that cleanroom collaboration.
This Guidance aims to help users getting started with AWS Clean Rooms collaboration. The reference architecture first illustrates how users can set up an AWS Data Clean Rooms data collaboration and prepare data. Then it illustrates how to use Amazon Athena and Amazon QuickSight for further analysis and visualization of the results produced as output of that cleanroom collaboration.
Scenario
Customers (advertisers, publishers, data providers) use AWS Data Clean Rooms to collaborate on private data without exposing secure information between parties. A typical use case for AWS Data Clean Rooms is when two parties are collecting different pieces of data about overlapping end-users or customers, and the two parties want to generate insights from the overlap of these two datasets, without exposing the sensitive or Personally Identifiable Information (PII) attributes within their first party data. With AWS Data Clean Rooms, each data provider can control what data the consumer is able to view, query, and aggregate.
This Guidance demonstrates how a customer could prepare data for an AWS Data Clean Rooms collaboration, and set up an analytics and insights stack on AWS to investigate the results of queries exported from the collaboration on AWS. The reference architecture demonstrates how AWS Glue can be used to crawl data stored on Amazon Simple Storage Service (Amazon S3) to create data that can be accessed through the AWS Data Clean Rooms interface. Once data is joined and analyzed within the AWS Data Clean Rooms, query results can then be stored on Amazon S3 and accessed from Amazon Athena for further analysis and visualization.
Data Prep
To utilize data within AWS Data Clean Rooms, it must first be added to an AWS Glue Data Catalog. This can be done manually or with the AWS Glue Crawler.
Preparing data and adding it to an AWS Glue Data Catalog must be done by each data provider contributing data to an AWS Data Clean Rooms collaboration.
Once data has been added to an AWS Glue Data Catalog, it can then be referenced within an AWS Data Clean Rooms collaboration and made available to the collaborators with custom analysis controls for each table.
Querying Data within the AWS Data Clean Rooms
Once at least two datasets have been made available to the AWS Data Clean Rooms collaboration, SQL Queries can be performed to join the datasets, run aggregation analysis, and more. The results of each query are automatically stored in a configurable Amazon S3 location.
At the end of this Guidance, we will share an example scenario with sample data and queries that can be run within AWS Data Clean Rooms.
Use of Amazon Athena
Amazon Athena allows you to query data stored in Amazon S3 with standard SQL syntax. With Athena, you can query the data where it sits, save your queries, and create views, which can then be used by Amazon QuickSight for visualization purposes.
In the reference architecture diagram, we can see how a user can utilize Amazon Athena to further query and analyze the results of an AWS Data Clean Rooms collaboration output. In much the same way that we prepared the data for use in the cleanroom, AWS Glue and Amazon Athena can work together to provide users easy access to a friendly SQL based user interface.
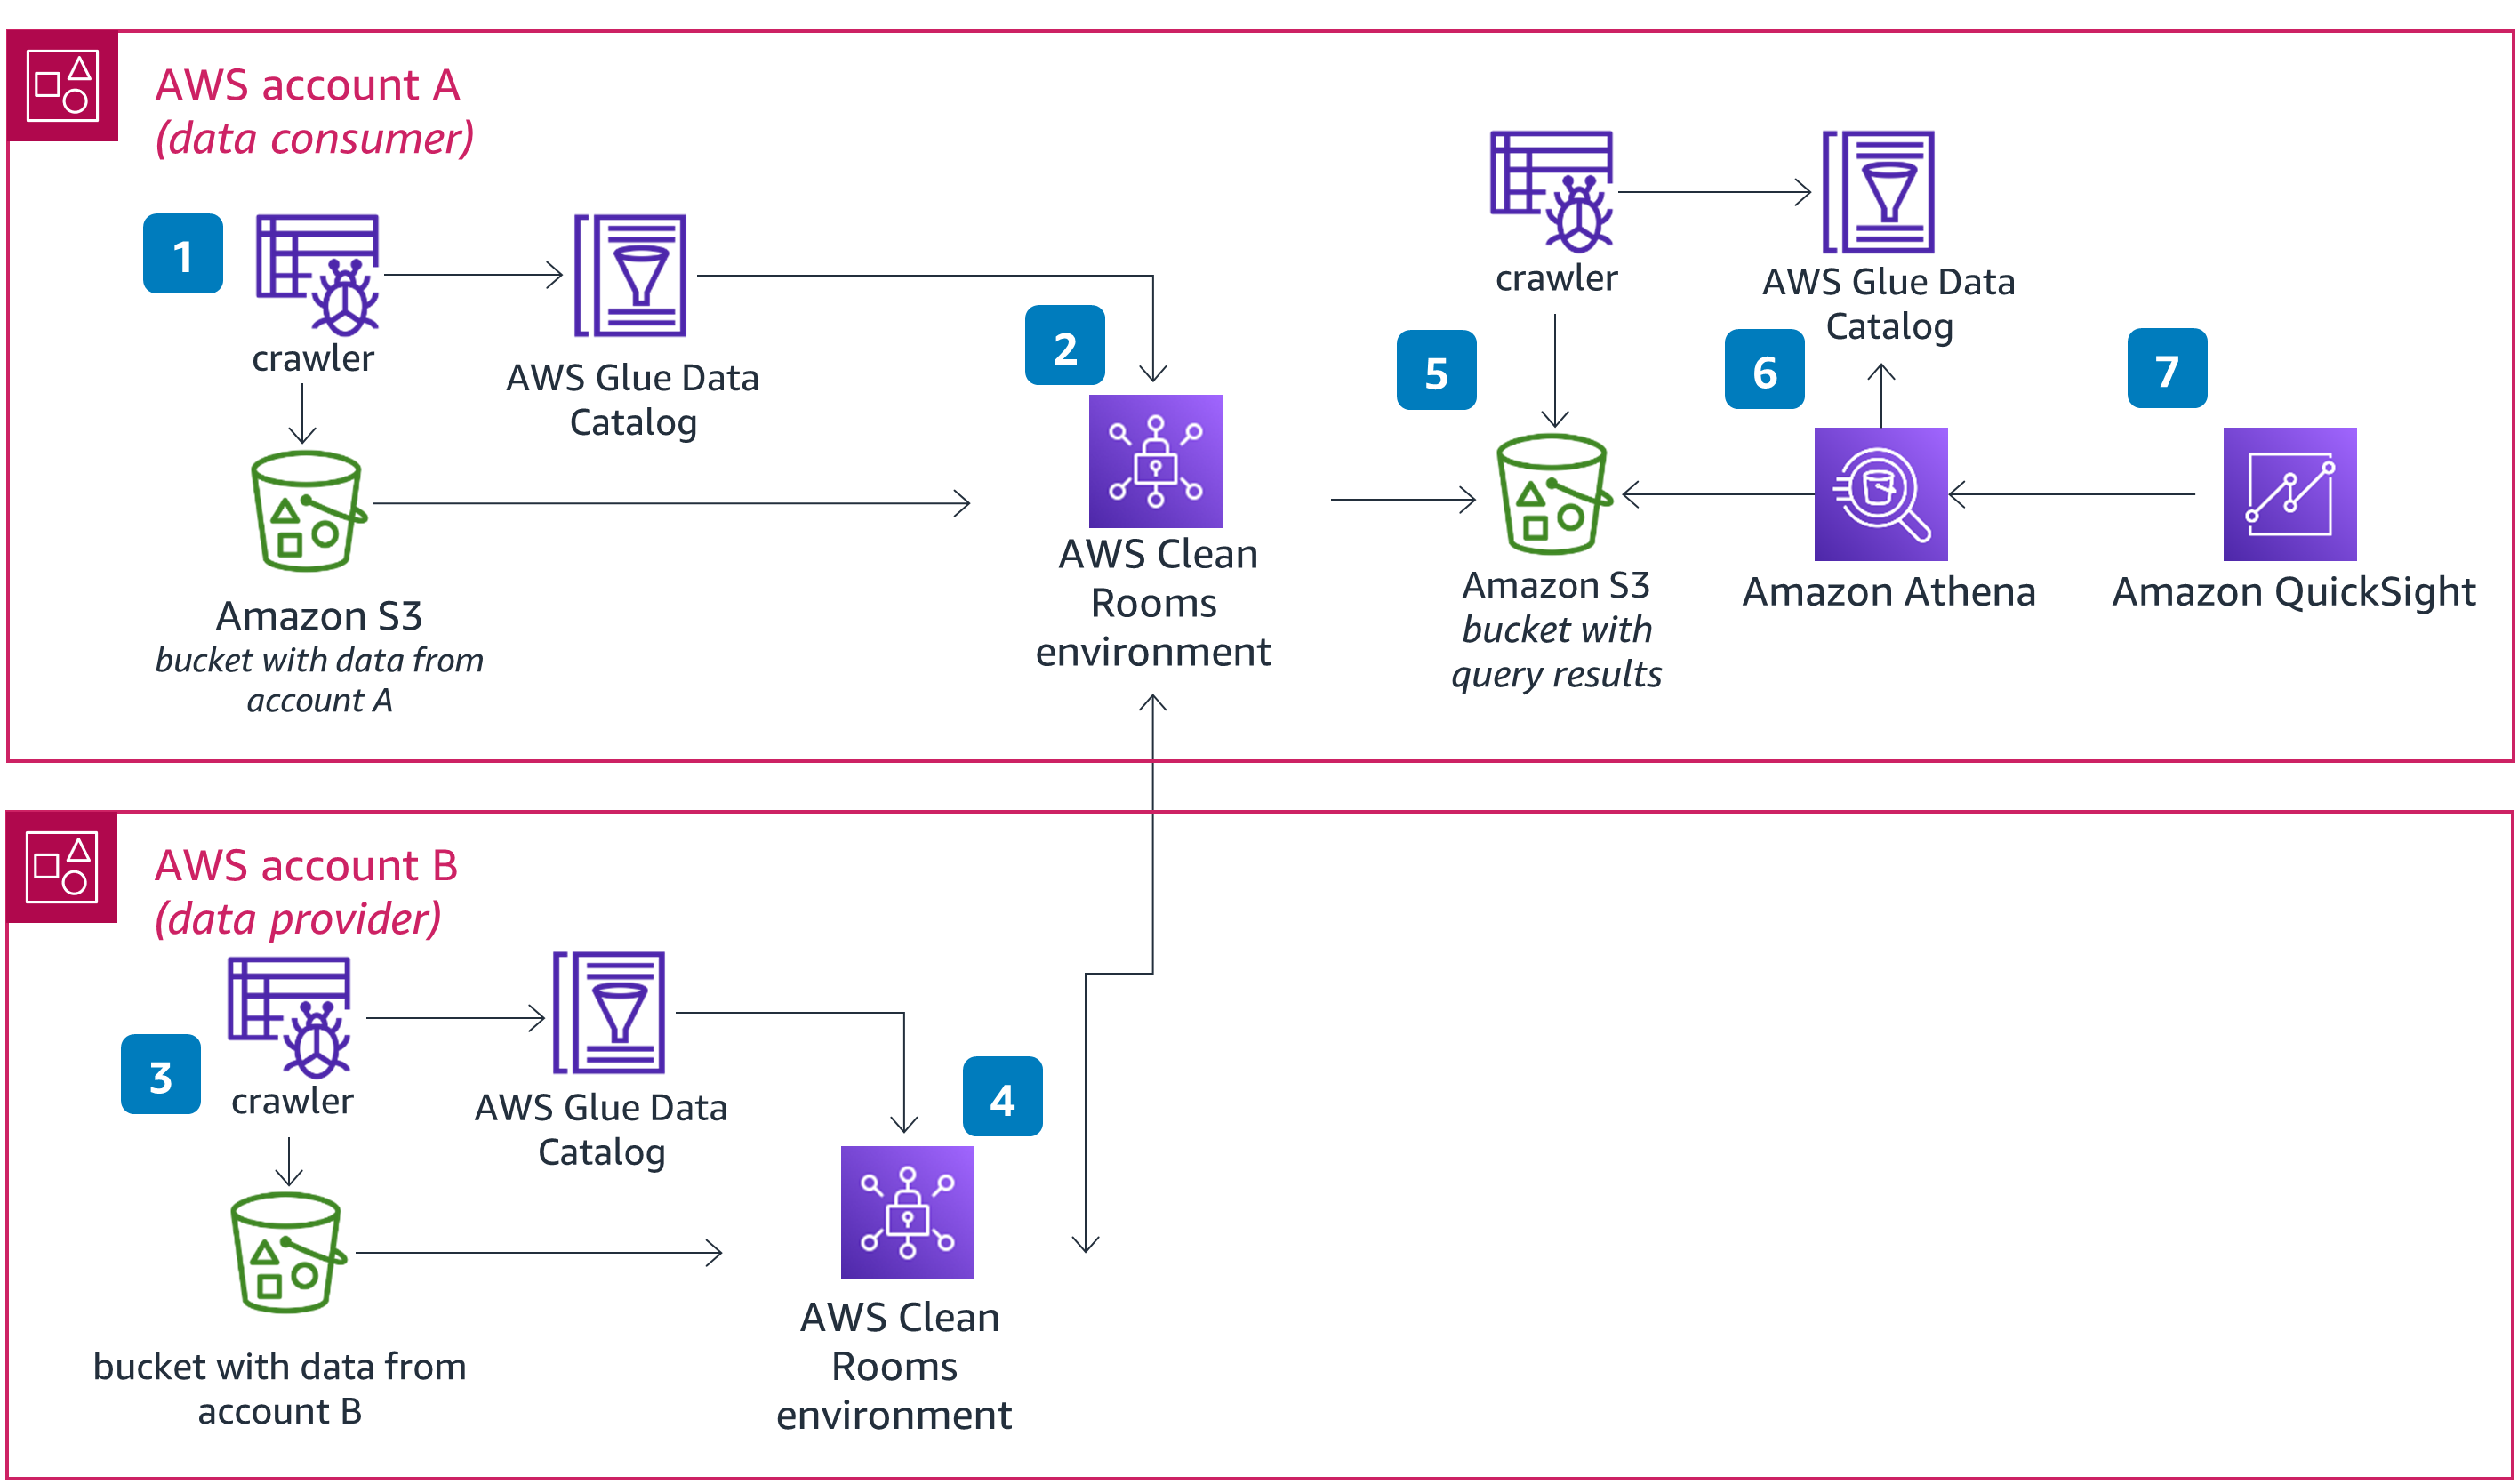
Figure 1 - Diagram for building queries in AWS Clean Rooms
Use of Amazon QuickSight
Amazon QuickSight is a business intelligence tool that can help you easily create complex visualizations of the query results from an AWS Data Clean Rooms collaboration. You can use QuickSight to build dashboards that can be shared among your team, embedded on web pages, and set to automatically update whenever there is new data available.
The first time you navigate to Amazon QuickSight, you will need to select a plan and set up your organization name. You will also need to make some choices in terms of what Amazon QuickSight has access to. Select Athena and the Amazon S3 bucket where your AWS Data Clean Rooms query results are stored.
Once you have QuickSight enabled, you can connect Amazon Athena as a data source. Once connected to your data source, you can use QuickSight to build an analysis of your dataset.
Example Scenario and Queries
In this example, we will consider two entities who want to create a collaboration between their potentially overlapping datasets.
Entity A is an eCommerce company. This company has first party data pertaining to its customers in the form of email addresses, names, and physical addresses. This data has been collected over time through a variety of transactions, including website conversions.
Entity B is an advertiser. This company places ads on behalf of their clients and captures impression data, including email addresses, campaign IDs, and more.
Entity A has contracted with Entity B to run ad campaigns for their upcoming sale. Entity A would like to know details about the success of their campaigns with Entity B, but neither entity wants to compromise the privacy of their users. So, they use AWS Data Clean Rooms.
Entity A has data about their customers that looks something like the following:
fields = [
    "email_address",
    "date_created",
    "state",
    "city",
    "country",
    "zip",
    "first_name",
    "last_name",
    "status",
    "birth_country"
]
Entity A also has data about conversions on their website that looks like the following:
fields = [
    "email_address",
    "date",
    "creative_id",
    "event_type",
    "version",
    "price",
    "currency",
    "transaction_id"
]
Entity B has impression data from users who viewed ads placed by Entity A. This data looks like the following:
fields = [
    "email_address",
    "date",
    "creative_id"
]
Once both entities have created a collaboration in AWS Data Clean Rooms and shared their tables, Entity A, the Data Consumer, can run queries like the following:
1. Find the overlap between Entity A’s conversions data and Entity B’s impressions data:
SELECT COUNT(DISTINCT c.email_address)
FROM conversions c
INNER JOIN impressions i
ON i.email_address = c.email_address
2. Overlap Analysis, segmented by Creative ID:
SELECT COUNT(DISTINCT c.email_address) as counts, c.creative_id
FROM conversions c
INNER JOIN impressions i
ON i.email_address = c.email_address
GROUP BY c.creative_id
ORDER BY counts DESC
3. Overlap Analysis, segmented by Price:
SELECT COUNT(DISTINCT c.email_address) as counts, c.price
FROM conversions c
INNER JOIN impressions i
ON c.email_address = i.email_address
GROUP BY c.price
ORDER BY c.price DESC
4. Audience Analysis:
SELECT COUNT(DISTINCT c.email_address) as counts, crm.c_birth_country
FROM impressions i
INNER JOIN conversions c
ON c.email_address = i.email_address
INNER JOIN customers crm
ON c.email_address = crm.c_email_address
GROUP BY crm.c_birth_country